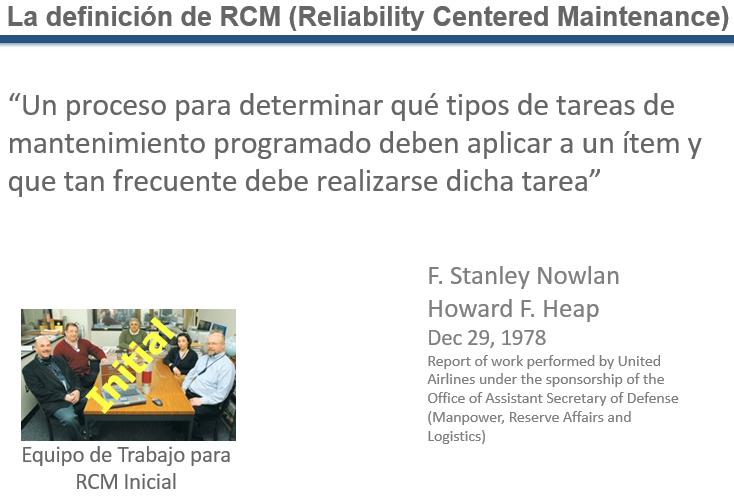
The material in these presentations represents 15 years of development by John Moubray. Moubray was the most significant popularizer of the maintenance decision techniques embodied by Reliability Centered Maintenance (RCM). RCM was developed by Stanley Nowlan and Howard Heap who described their findings in a report issued on December 31, 1978 , called, “Reliability-centered Maintenance”.
The definition as proposed on Slide 1 describes the purpose of RCM. But it reveals nothing about the process, its techniques, nor the thinking patterns by which we will accomplish the objectives of RCM.
RCM provides stakeholders with an information structure or data model for representing maintenance related situations. Using the RCM data model, we organize the complexity of maintenance into a standard structure of elemental concepts. In this form maintenance knowledge becomes amenable to systematic discussion, documentation, review, and Reliability Analysis (RA)
From the photograph in Slide 1 we may infer that RCM is a group activity conducted by subject matter experts. The challenge: To transform the group’s accumulated knowledge, reasoning ability, and experience into a defensible maintenance program. And to do it quickly, completely, and accurately. We credit John Moubray with developing the methodology of the “facilitated RCM review group”, an effective but not the only RCM analysis method.
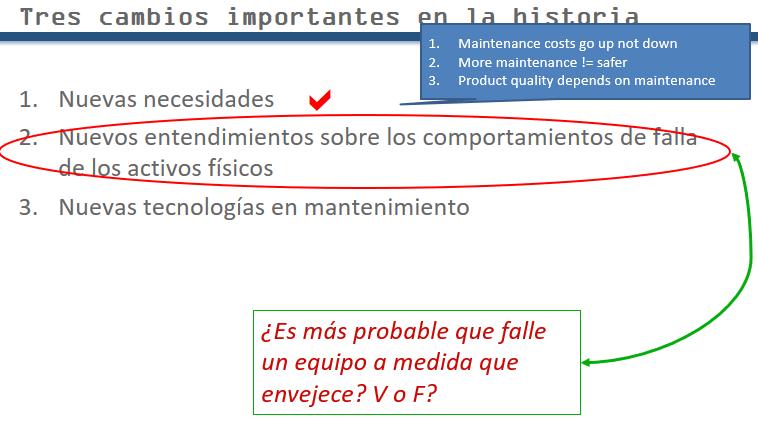
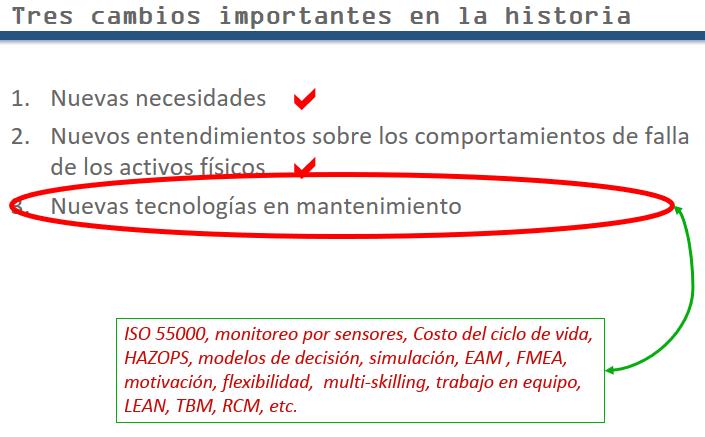
RCM’s appearance on the maintenance scene can be understood as having evolved through necessity. In the historical context, accelerated changes in maintenance theory and practice trace back to to the 1930’s. Moubray outlined 3 sweeping changes (slide 2) in the world of maintenance. The changes, as dramatic as they were overall, occurred gradually, and almost imperceptibly to those engaged day-to-day in maintenance activities. As a result of these sweeping, and sometimes obscure, changes surprising anomalies and misconceptions prevail, even today, in maintenance practice.
Socratic method
In the tradition of John Moubray this RCM Introductory course practices the Socratic [3] method in training RCM analysts and facilitators because RCM itself is, of necessity Socratic. The tutor (facilitator) asks questions, ostensibly, to keep students awake, to encourage interaction, and to cause them to think. But the more important reason is to fuel the process of self discovery. Participants discover that “the answer didn’t come from ‘him’ it came from me”. This was Moubray’s way to encourage and elicit the deepest knowledge and it is key to the process of the “facilitated RCM review meeting“.)
The tutor asks the questions. “What must he not do?”. “Answer them”. Otherwise he will be training analysts not to answer but to wait for the facilitator to come up with an answer. If, you, as a facilitator get a blank look, rephrase the question. Resist the temptation to answer it yourself.
Expanding expectations of Maintenance
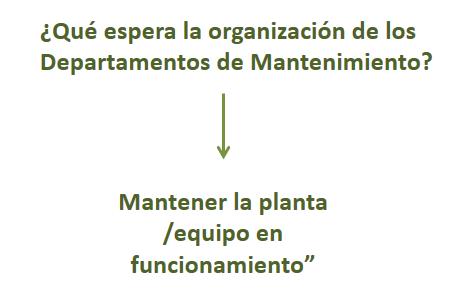
Why does the maintenance function exist?
The first response to the question of Slide 3 will usually be, “To keep the plant running.” That’s the answer we seize because it is elementary and we wish to begin from first principles. Some more formally educated people might say, “To maximize or optimize availability”. It’s the same thing.
(Some one will correctly add “Cost” to the list of expectations. That’s another good answer. The tutor writes them both down immediately on a flip chart.) Indeed the requirement to “keep the plant running” is the primary role of maintenance. In fact, as the next series of slides impart, it is more important today (the recent two decades) than ever before. Why is that? There are three principal reasons.
Why is keeping the plant running of particular importance today?
Expanding automation
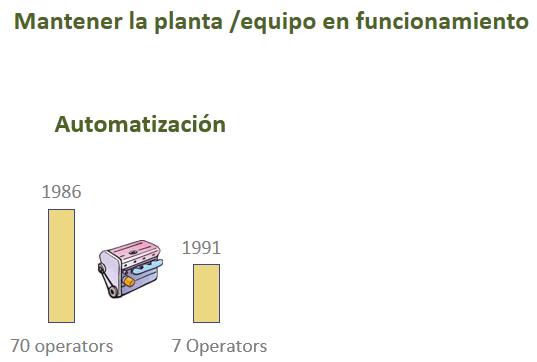
We describe the first of those reasons (why keeping the plant running is more vital today than in previous epochs) by considering the evolution of an engine assembly plant over five years from 1986 to 1991. The instructor asks “How many operators were required to produce the engine in 1986?”
Answer: Seventy operators.
How many operators were required to produce a similarly sized engine five years later in 1991?
Answer: Seven operators. One tenth the labor. Did the plant in 1991 require more or less maintenance? Answer: More. Why?
Answer: Mechanization and automation.
As capitalization intensified, with the purchase of robots and associated technology, the plant needed to “keep running” in order to pay the interest on the capital used to purchase technology. How do you lay off a robot? This explains why “Expanding Automation” is the first reason why keeping the plant running is more important today than at any previous epoch. Notably, automation requires more maintenance, not less. A fact oft forgotten in management circles.
A vital technique in Socratic teaching asks “So what”. We must draw appropriate conclusions from each narrative. What is the point of this story? It is the extent to which Ford and every other manufacturer began to depend on machines rather than people. Previously, business was very dependent on operators. Most assembly was done by hand. Now operators have become “machine attendants” and the assembly is actually done by machines.
A dramatic example of this in the service industry is the proliferation of bank ATMs. When is the last time you spoke face-to-face with a bank teller? That is a technology that didn’t exist 40 years ago. It became the main way (until Internet banking appeared) retail banks interacted with their clients. Keeping that equipment running has become a central part of retail banking. You can pick any industry and you will find similar examples of the expanding use of automation, and hence, the expanding requirement for maintenance.
The first of three reasons for the growing importance of maintenance in keeping the plant running is then, “Expanding Automation”.
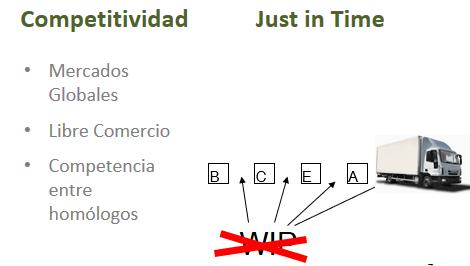
Competition and JIT
The second reason: Global commerce and free trade means that if something can be made or extracted better and cheaper elsewhere, it will be. Moving product across international borders is now commonplace. Engineers, operators, maintainers, and managers in almost every industry compete with their counterparts in Asia, Latin and North America, Africa, and Europe.
The third major reason in Slide 6 is “Just-in-time manufacturing”. An example from the pulp and paper industry will help describe this phenomenon, particularly, with regard to the last steps in the transformation of the product, toilet paper.
the winding operation
the chopping operation
the wrapping operation, and
the stacking operation
It had been the practice to stockpile semi-finished goods between operation stations, just in case upstream operations experienced problems. That way the downstream operations could continue producing. These stockpiles were known as “WIP” (work in progress) . In the early to mid-nineties corporate accountants turned their attention to production. What was the first thing to disappear? WIP.
With the disappearance of the work-in-progress was the equipment required to be more reliable or less reliable? More reliable. Any outage had a ripple effect downstream and directly on customer service. Was the stacked finished material stockpiled in a warehouse? No, it was, as much as possible, placed directly on the truck.
Who is the largest single retailer of toilet paper in North America? Walmart, with 33% of the market. They have an interesting policy developed in the 80’s by which they manage their suppliers, called “three strikes and you’re out”. For the first mistake, say, a missing bar code or a late delivery, $20,000 comes off the next invoice as penalty. The second offense, $100,000, and the third time, the supplier is out – for two years, whereupon he is entitled to re-apply to be listed by the Walmart purchasing department. Scott paper was at Strike 2, when they called upon RCM. They managed to improve reliability with the result that they avoided the ultimate penalty.
Cost
You mentioned “cost” as a second important role of maintenance. In fact, it is so important in today’s economic reality, that we will project costs over the next 20 years. First we ask, “What are people in maintenance expected to control?” “Cost-effectiveness.” Notice that we do not say merely “cost minimization”. RCM practitioners are increasingly concerned with this point. Organizations are under pressure to cut costs. Typically, downsizing involves the reduction of every department by a uniform number of “heads”. Accountants propose that we cut operations and maintenance equally. Voluntary redundancy schemes are divided homogeneously throughout. Is this logical in the light of the foregoing? Frankly, it is extreme folly. Why? Recall the engine plant of Slide 5. Do the machines maintain themselves? The maintenance side of the budget, ought to be growing – contrary to conventional cost cutting wisdom!
The future cost of maintenance
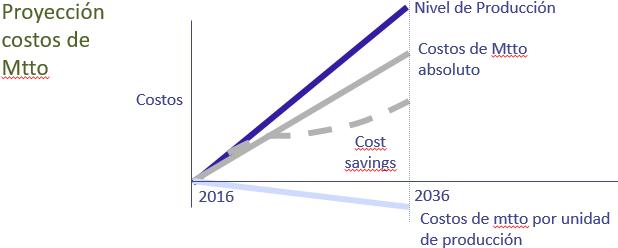
Cost is indeed important, so much so that we will project costs over the next 20 years. In the average production plant, will volume rise or fall over the next two decades? Rise. Globalization and rationalization resulting in the closing of less efficient operations will cause production in the remaining plants to rise. What about the absolute cost of maintenance? Will it rise or fall? It will also rise. Perhaps not at the same rate. The inflection in the dashed curve indicates taking advantage of economies of scale and improvements in efficiency.
Is there a maintenance cost key performance indicator (KPI) that will fall? The relative (per production unit) cost of maintenance will drop since output will grow. This is not what managers and financial controllers are accustomed to hearing from proponents of maintenance improvement. Here at last is something concrete and logical which they can take to top management in order to justify more maintenance resources. We are saying, “Sorry but in reality absolute maintenance costs will rise over the next 20 years. You might have a very inefficient maintenance department. So we might indeed get a 2-3 year short term reduction in the rate of rise (dashed line of Slide 8 ) of absolute maintenance costs. But ultimately the trend is upwards.
There is another important point about reducing costs. A pet food company’s equipment, a stainless steel conveyor belt, called a “chain”, carries closed cans of product through an autoclave or pasteurizer. The lubricant needed under these conditions was expensive. A recently appointed engineering manager, convinced by a good lubricant salesman, decided he didn’t need so exotic a lube. The company saved $1M over the next three years. And manager got brownie points for having made this ‘clever’ decision. He stayed in his position over those 3 years, whereupon he moved on to bigger and better things. What happened in the 4th year? Of course, the chain broke. Who got blamed? His successor. What is our point? That it’s easy to do inappropriate cost cutting. (It’s sometimes possible to cut appropriately.)
The Longford gas plant blew up in Victoria, Australia (1998)
Over the previous 2 years management had received praise for having reduced the maintenance budget. They saved a bit of money. But was it clever?
This is the mindset that RCM practitioners fight against in their organization. Their weapon of choice is the RCM analysis or knowledge base that links tasks to required asset capability. RCM analysis highlights the consequences of failure. It then sets specific tasks designed to mitigate the consequences. In budget discussions, armed with analysis we can ask the manager, accountant, “Which task I should cut?” Suddenly they decide to cut elsewhere. It is a fascinating use of RCM analysis – to defend the well considered maintenance decisions. This is a powerful “so-what” point!
Another important point when talking about cost, is a belief that RCM is going to reduce, massively, your maintenance cost. In many cases, the maintenance organization will not spend any more or any less. Rather, it will be doing more effective things in maintenance (in order that overall cost per unit of product will fall). In some cases costs can fall. The Royal Navy found that they were able, by applying RCM to their mine hunters, to save 1/2 the cost of overhauling 1 mine hunter.
Cost savings contradiction
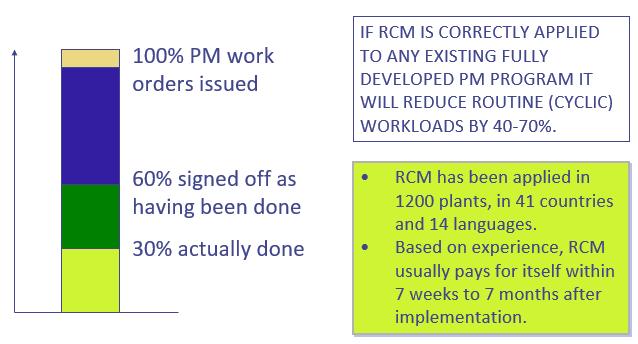
Cost in maintenance is fraught with contradiction. This is where we have to be so careful because we’re going to appear to contradict ourselves, with this declaration: “If RCM is correctly applied to any existing fully developed PM program, it will reduce routine (cyclic) workloads by 40-70%“.
What do we mean by cyclic? It is maintenance work, including overhaul, service, and inspection undertaken at fixed age or calendar intervals. This might include vibration measurement, reading a gauge, performing an overhaul, failure detection, and other time or age based (including condition monitoring) activities.
The savings assertion has to be qualified very carefully because of the reality concerning PM in most industrial settings. We ask the question, “How many PM work orders are signed off as having been done?”. Different industries will cite different compliance data. On the average 60%. We then ask how much was really done. The answer, generally speaking, is about half. 30% is the global average. 100% in aviation and offshore oil platforms. Similarly on nuclear submarines they tend to do their preventive maintenance. In other industries what percentage of the signed off work actually gets done? International average, when asked around the world, is 30%.
This point about “perceived maintenance done” is lost on many RCM consultants. If we go to real 30% from a perceived 60% – what is our cost saving? Zero. We’re caught in the contradiction, “Boss I’ve cut my PM workload by half … but I need two more people to do it.”
On the other hand if you have high real compliance (for example in the military where they tend to do what they’re told) the “book” savings can be dramatic. But in the anarchic environment of industry this is generally not the case. The major saving as a result of implementing RCM is improved performance, lower risk, and reduced per unit of output cost of operation. With RCM, we aim to make sure what we do spend on cyclic maintenance is spent where it will do the most good.
The HSE imperative
Someone in maintenance often says that they “haven’t got the resources to do it (RCM) properly”. This is not an acceptable defense in court. To illustrate we ask, in Slide 10, “What else, besides cost and operational reliability, is expected of the maintenance department?”
What turned Piper Alpha into a disaster?
There is a widely held belief that, “The more maintenance the safer.” In the minds of the public, i.e. the media, a disaster is invariably due to cutting back in maintenance spending. Sometimes this can be true, for example, Longford. In general, this is not true. The 3 biggest accidents in industrial history (outside of mass transport and mining), in terms of the number of fatalities, were not the result of “cutting back” maintenance. In fact it was the contrary.
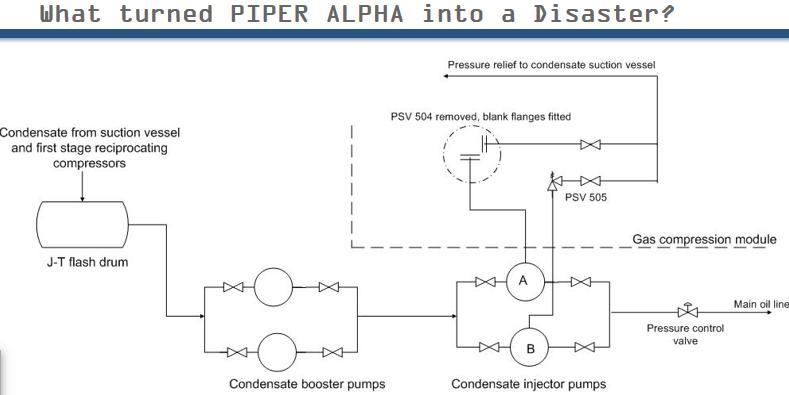
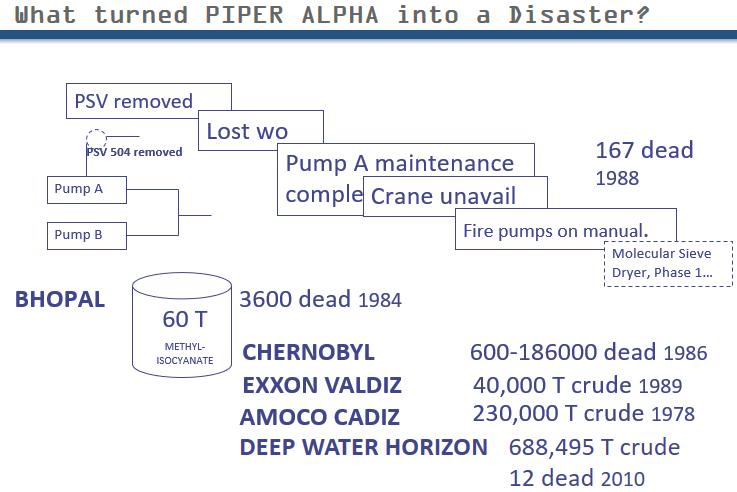
1. Piper Alpha. What turned Piper Alpha into a disaster? What question have we not asked? “What caused Piper Alpha?” There is a deliberate, subtle difference.
Exercise – Read the short article from the “Off-Shore Engineer” publication. There were two theories. The 1st hypothesis turned out to be true. Question: “Was it lack of maintenance?” How much maintenance was underway on the platform at the time? Can you name the one event that turned it into a catastrophe from a minor controllable coincidence?
A whole string of things happened. But what was the villain? Most people will home in on the lost document, especially RCFA people. The procedures were in place. But they weren’t followed. But was the misplaced note really the villain? Was it the absence of fire protection? The rig would have been blown to smithereens anyway even had they been on automatic mode. Why were they on manual? Answer: “Because someone was doing maintenance.” The individual who was supposed to give orders to jump was dead. If they had all jumped right away a lot more would have survived.
Coinciding events:
A duty pump failed
A standby pump didn’t work
A document got lost
A crane wasn’t available
The fire pumps were on manual
The system was operating on high pressure (phase 1) because of maintenance elsewhere
and so on …
Right at the end of this chain of events was a missing safety valve. Where was that valve? Removed. For what reason? Maintenance. This was the essential cause – the idea that you can remove a safety valve, notwithstanding lockout and other regulations. They should have either had alternative protection or found a way to test it in place. In was an inappropriate form of maintenance that should have been exposed during an (RCM) analysis when setting up the mitigating activities related to “failed safety valve”. One of the survivors was the Score (contractor) technician. He said the valve was ok. They couldn’t put it back because the crane was engaged elsewhere. The point is that it was not a lack of maintenance. Maintenance of all kinds was underway. The wide belief, “more maintenance = safer” was dispelled by the investigators? Maintenance did the specified task but it was the wrong task. True, the piece of paper got lost, but that’s a red herring.
2. Bhopal. Similar to Piper Alpha there were 2 radically different schools of thought on the why this disaster happened. The tank capacity was 60t. It was used to contain methyl isocyanate for the production of pesticides and fertilizers. This compound, when exposed to water, releases noxious, explosive gases. Someone had attached a water hose to the tank and poured water into it. Some experts claim it was sabotage. However the person who did it was one of the 3600 who died. The other school of thought was that the person assigned to cleaning put the hose on the wrong tank. What is cleaning? A form of maintenance. They had scrubbers which were supposed to get rid of the isocyanate prior to cleaning. They were however undersized and poorly maintained. Another case of “doing the wrong job”.
3. Chernobyl. Biggest industrial accident in history. 600 – 186000 dead. They’re still dying. Book “The Truth About Chernobyl” was written by Soviet physicist Grigori Medvidev. He was involved in building Chernobyl. Also in recruiting. Apparatchiks were in charge of Chernobyl. His book has a chapter called, “The last 25 minutes, and the last 25 seconds”. A group of engineers believed the system could suffer a total transitory power failure. They believed the momentum could generate enough power to restart. Another group said no. Eventually they decided to do a test to conduct an instantaneous power failure. They blanked off pumps and disabled other safety systems as needed to perform the test. It caused a reactor meltdown. In attempting to mitigate the disaster, they dropped the control rods. They didn’t understand the design ad thus aggravated the problem. This was a case of human intervention in an otherwise stable system. They were mucking around when they shouldn’t have been. 100T of radioactive material was released to the environment in an industry where 200 grams is considered disastrous. The same key point is made – this also was not lack of maintenance.
One may easily come to a false conclusion from listening to the foregoing. If the RCM practitioner is not careful people might think he is proposing, in citing Chernobyl, not to do anything. The real message is, “Make absolutely sure you’re not doing things in the name of maintenance that exacerbate the risks.”
The biggest single non fatal environmental disaster was not the Exxon Valdez that dumped 40,000T crude. Rather, it was the Amoco Cadiz that dumped 220,000T crude 1976, due to a steering gear failure – i.e. a maintenance issue.
In the Deep Water Horizon disasterBP pleaded guilty to 11 counts of manslaughter, two misdemeanors, and a felony count of lying to Congress. Criminal and civil settlements and payments to a trust fund cost the company $42.2 billion. Two site managers were charged with manslaughter for acting negligently in their supervision of key safety tests performed on the rig prior to the explosion and failure to alert onshore engineers of problems in the drilling operation. BP and rig operator Transocean didn’t test the blowout preventer’s individual safety systems. They just tested the device as a whole. It turned out there were two sets of faulty wiring that caused problems and a dead battery. Individual tests were suggested by the preventer’s manufacturer but the companies instead followed a standard set by the industry.[5]
Product quality
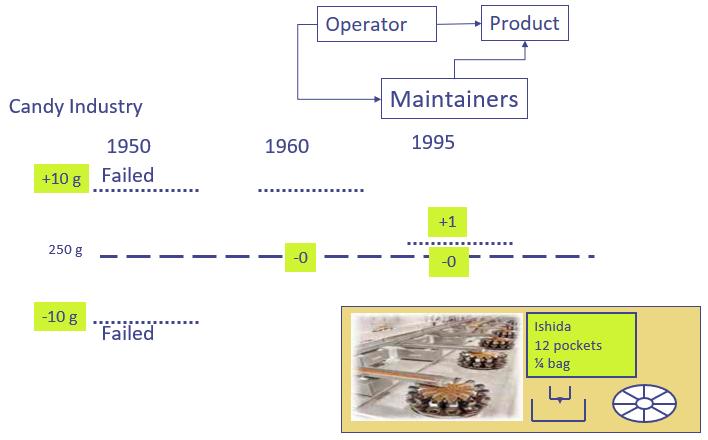
We illustrate this with an example from the confection industry. The top part of Slide 14 describes the interaction between operator and product. This evolved to a three party interaction among maintenance, machine, operator.
The middle of the slide describes a tightening of tolerances over the years between 1950, 1960, 1996. The bottom of the slide illustrates how the Ishida candy packing machine solved the riddle of obtaining a filling accuracy of 1 gram when individual candies weighed more than a gram.
Animation: Packing candies into a bag. In 1950 250 g tolerance +- 10g defined failure. 1960s: trade regulators came along to spoil the party. 250 + 10g -0 were the new limits defining failure. A hopper with a crude simple spring loaded mechanical dumper met this requirement. It was easy to fix when it broke. Who came along to spoil this party – the accountants.
Fast forward to 1995. The tolerance was now +1 -0. The weight of individual candy can vary by more than a gram. The limits defining failure shrank by 20x. Completely different technology was required. Ishida provided a filler with 12 pockets. It weighed the contents of each pocket. Then it found 4 pockets which, combined, weighed 250 +1-0. Could ordinary techs repair this machine. No. Initially, they had to fly a technician from Japan when this machine broke.
Product Quality (accuracy, precision) requires the implication of maintenance. This reality reinforces that point of Slide 5 that operators oversee rather than do. The so-what point? The relationship between product quality and maintenance has taken the foreground. The impact on maintenance – skills have changed. No longer can it be done by anyone with a screw driver. The standards to which they have to maintain the machine have gone up astronomically. Yet ask your average maintenance manager what’s your big problem. They often won’t mention product quality. We’re talking about trains being on time, the accuracy of missile systems, the list goes on and on.
TPM also deals with quality. We examine the inter-relation between TPM and RCM. One consultant (Ron Moore) published an article that said we need to do both. However, if you do RCM properly you don’t need TPM. Suzuki, who wrote “TPM in the Process Industries” confirmed this. TPM needs RCM. However, the reverse not true.
RCM asks questions. TPM gives answers. RCM will drive you towards the TPM solutions, but the reverse is not true. RCM deals with quality issues much more precisely than does TPM. “Would you fly an airplane with TPM?” At least it will be clean. TPM deals with the surface of the machine. It tries to go deeper within the system by installing transparent covers. The Mercedes axle plant, producing truck and bus axles, began with TPM, but eventually realized that they needed RCM.
Resuming, maintenance is expected to perform in five ways.
The so-what point is that the maintenance department must systematically recognize a multitude of functions that need preservation which are not obvious. The maintenance department, more and more is ultimately responsible for product quality, safety, and environmental integrity.
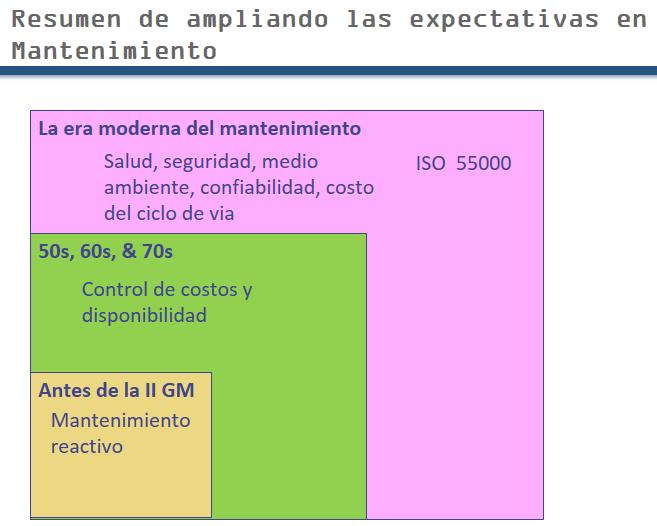
Summary of expanding expectations of Maintenance
This slide summarizes the expanding responsibilities of maintenance.
First generation: Fix when broken.
Second Generation: Growing mechanization. The focus was on availability and lowering cost. Because the assets were getting expensive a reasonable amount use (availability) was required. Third generation: availability, reliability, cost effectiveness, safety, quality, environment, longer asset life.
Third generation: A huge step increase in the responsibilities of maintenance.
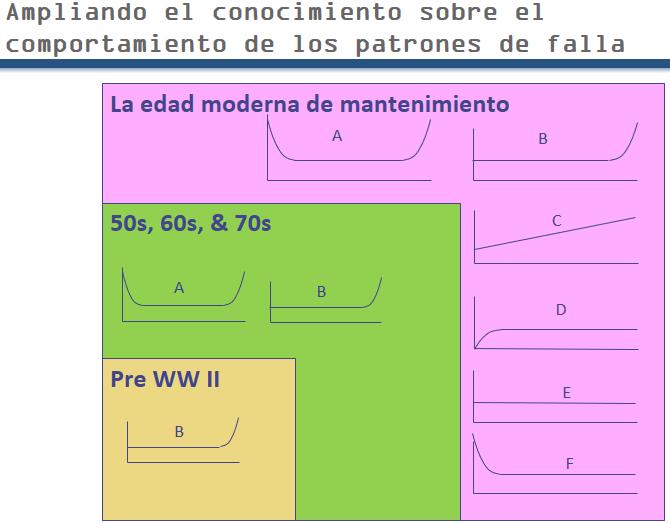
New understanding of asset failure behavior
The second broad change in maintenance took place on the psychological and philosophical planes. Our understanding of failure behavior that defines when failures are most likely to occur, has altered. Conflicting opinions among participants when answering the (true of false) question in the slide testify to the inertia of long held ideas.
Most of this introductory RCM session is designed to unfreeze popular belief. What have we challenged so far? Maintenance costs cost will go up not down. More maintenance =! safer. Product quality depends on maintenance.
A good number of the course participants will say “false” to the T of F question. But do they believe it really? To infuse a change in thinking, we take the student out of his environment to the realm of aviation.
Commercial aviation
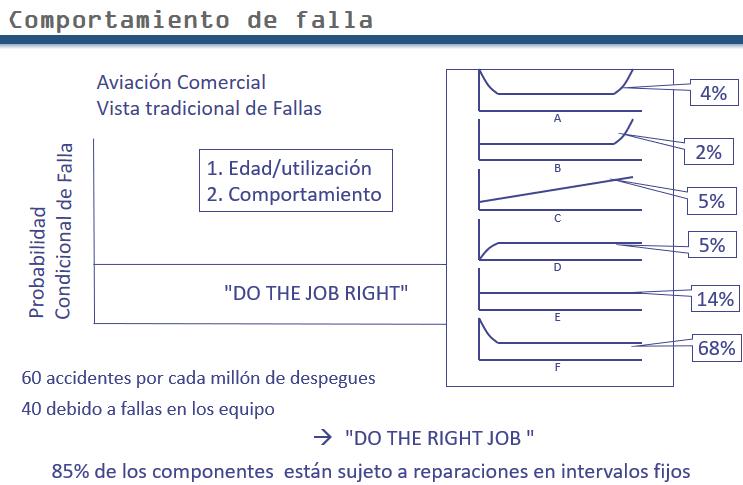
Say you’re the airline’s chief maintenance engineer. It’s 1955. You go out onto the tarmac. Model 1 has landed. It’s packed with new technology that you’ve never seen: gas turbine, hydraulics, pressurized cabin. You’re expected to develop a maintenance program for this aircraft. You have been taught that everything behaves like the graph. But you don’t know the life, the point of rapid rise of the conditional probability of failure. What do you do? You’re going to have to hazard a guess (SWAG)[6]. You’ve got to start somewhere. The maintenance chief used his experience with piston engines. Result: Aircraft took off. Some of them flew back.
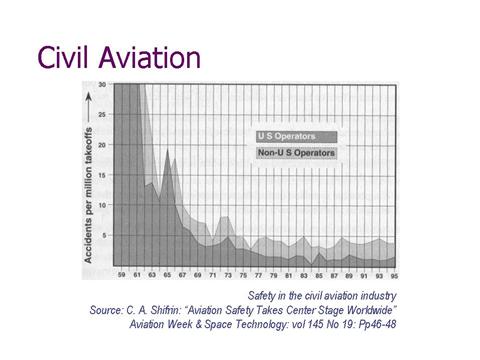
Fast forward to 1960 – the dawn of the information era. In 1960 there were 60 crashes per million takeoffs. Is this is a good figure? Answer: In today’s terms the number would scale to 2 crashes of a Boeing 737 or bigger per day.[7]
Second point: 2/3 of the 60 were due to equipment failure. Some of you are getting the feeling that these number are not very good. Fortunately its hypothetical for the course participants. Into your office walks the head of your pilots’ union, the passenger representatives, the insurance company representative. Conclusion: “There must be something wrong with my maintenance”. What do you do? Notice how many questions we’re asking. You conclude, “I must be getting the life point wrong.” So you cut back the maintenance interval. Additionally, the airlines compiled more detailed procedure manuals. The added controls on the quality of work.
They put their effort in “doing the job right”.
What happened? They got their second big surprise. Cutting back on the interval sometimes helped, sometimes it made no difference, but in most cases failures went up! Now we ask again, “You’re the expert – what do you do?” The RCM course participants are, obviously, anxious to hear the answer. They’re riveted.
In fact it took United Airlines a long time to answer to this question by a very small group headed by Stanley Nowlan. They said to their colleagues “when we guessed the maintenance interval – we were making not one assumption, we were making 2 assumptions:
age, usage
behavior
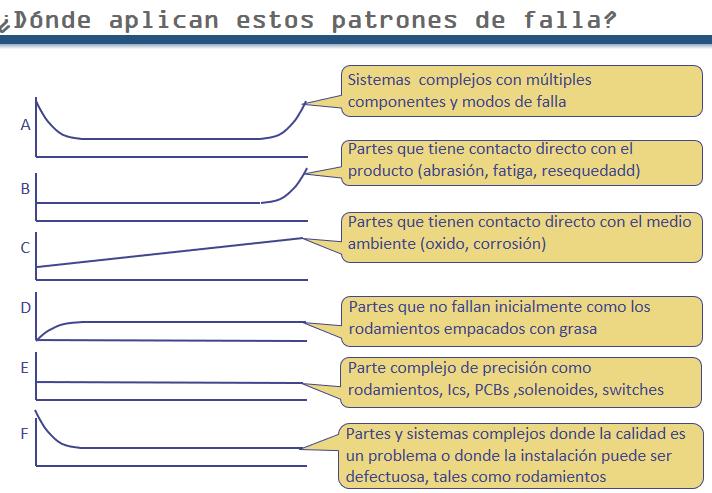
The only assumption we challenged was 1. Now we are challenging 2. To challenge 2 in those days was heresy. But they prevailed and embarked on the biggest piece of industrial research ever undertaken. They collected information on mechanical, electrical, and structural component failures. They found not one but 6 families of failure patterns. What do you do for E? answer: Nothing. If you overhaul you will be reducing availability. F: reverse J curve. Overhauls will actually increase failures. Now your hypothetical maintenance manager is starting to get concerned. He’s sweating, figuratively speaking, on the tarmac.
There will be a voluntary additional session at the end of day 2 from 5:00 pm to 6:00 pm called, “The Meaning of Life”. There are three very distinct contradictory meanings. During the session we’ll show what pattern B and E represent.
Percentages corresponding to each failure pattern: A 4% B 2% C 5% D 7% E 14% F 68%. This was in an industry which believed that 85% was “A”!
Now you’re the chief engineer of that airline. What do you do? You ask yourself if their might be a correlation between your observations over the past 5 years and Nowlan’s results. We might be doing the job right. But are we doing the right job? We realize that the answer is probably no.
The reality of failure
A, B, and C apply to single dominant age related failure modes. Automobiles of the late 1970’s 76-81 rusted (pattern C). Why not before and not so much since? Manufacturers discovered finite element analysis. They found that they could make the metals much thinner and still achieve adequate strength. In northern hemisphere in 1970’s governments started putting large amonts of salt on the road. Rust became the dominant age related failure mode. (Lancia, you could punch a hole through the hood with your finger). In the early 80s they started galvanizing and rust proofing.
Pattern B: tires, pump impellers, grinding wheels, saw blades, metal forming dies, chucks, – parts which have direct contact with product.
Patterns: D E F: Associated with complex equipment. Hydraulic and electronic components.
Do you draw this graph for a whole system or individual component? Answer: You draw it for individual failure modes. The consequences of failure determine the level (granularity) at which failure modes are defined. (Explained more fully in Slide 23.)
Aviation versus general industry
The overarching characteristic in the commercial aviation industry is governmental oversight of maintenance information and intense scrutiny of reliability documentation procedures.
Slide – Civil Aviation
All PM tasks in commercial aviation derive from the MSG3 program. The pillars of that program are:
Information gathering (known as, failure modes and effects analysis or FMEA)
PM (including failure finding, CBM, redesign)
Continuous analysis (age exploration ) for improvement. The improvement in failure management and reliability accomplished over the period that MSG3 evolved is roughly portrayed in the graph of Slide 20. (Approximately, 40% of accidents are maintenance related.)
The pressure to control costs in the face of intense competition characterizes maintenance management in commercial aviation.
Economic, safety, and regulatory factors have forced an intimate relationship between the maintaining (operating) organization and the equipment manufacturers. Tangible outcomes from such collaborations have been quantum improvements in equipment safety and maintainability. Of greatest impact are design features permitting easy detection of potential failures, built-in test equipment, instrumentation to render otherwise hidden functions evident, and backup systems for all vital functions.
With regard to information management, perhaps the single most distinctive activity in aviation maintenance is the careful recording and thorough analysis of as-found information when a maintenance task is performed. Knowledge management techniques such as case-based reasoning have, not surprisingly, germinated in that industry.
It is to be noted that these five characteristics of maintenance in commercial aviation are not dissimilar to those influencing most large industries today. Witness: 1. increased government oversight through agencies such as OSHA and EPA , 2. the growing need to improve reliability in the face of global competition, 3. tightening cost-price pressures, 4. greater collaboration between the OEM and the user as a result performance contracts and maintenance outsourcing, and 5. the growing understanding of the need to collect and analyze “good” data.
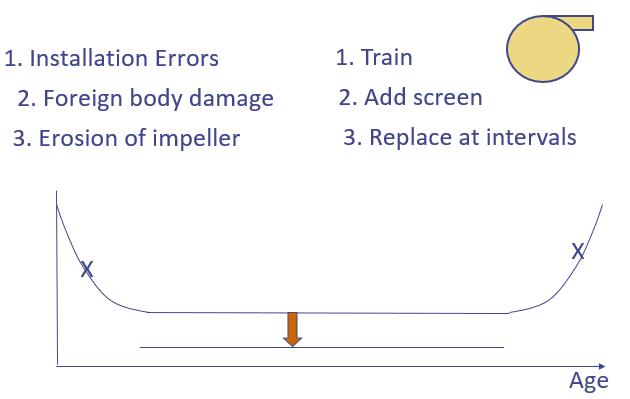
Failure pattern A
Assume that a component, a pump, has 3 failure modes whose consequences are managed as follows:
Impeller wear – replace at interval
Foreign object damage – redesign – add screen – this failure mode probability is reduced significantly
Train installers – this failure mode probability is reduced significantly
So we end up with E. We drew the failure rate curves for individual failure modes. We see that in unmaintained scenario, with all 3 failure modes active, we have “A”, the bathtub pattern. The seal life might be 6 months while impeller life may be 2 years. If you look at average system as a whole, ignoring, preventive maintenance, you’ll often see pattern F. The case of rust if dominant can override this.
The three epochs of expanding understanding
The change in understanding by engineers and maintenance staff regarding equipment failure behavior is represented by these expanding boxes.
Life cycle costing
What do we mean by life cycle? How long does a car last? In one case, 1.6 million miles – Plymouth taxi operating somewhere in the mid west.
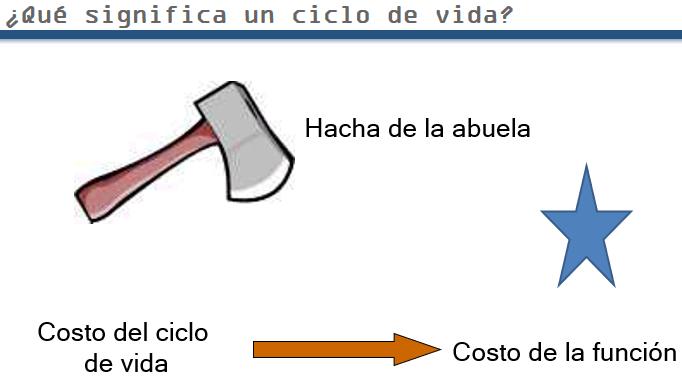
Grandmother’s axe. It has been out there in shed 40 years. In that time it has had 3 heads 5 handles. What was the life of grandmother’s ax? This riddle applies to all industrial equipment. In maintenance, our preoccupation is to preserve function rather than to preserve equipment. We’ve preserved the function of grandmother’s ax for 40 years.
When do the project design, implementation, and disposal costs become relevant? Note that we are questioning the preoccupation with life cycle costing by most people involved in maintenance. When did grandmother’s ax finally go to the scrap heap? Answer: when you bought a chain saw. A huge step in technology in order to respond an increased functional requirement. Assume the chain saw was made by Sears. Which parts will still be in the garage in 40 years? Maybe the frame. It is irrelevant how long the thing stays there. It’s the function that needs to be preserved. Life cycle costing is not as important as function costing as far as the maintenance department is concerned.
New maintenance technology
The massive increase in expectations has given rise to all these new maintenance technologies. An important question: At what point in time are we, as maintenance professionals expected to come to terms with all this new technology? Answer: Yesterday. A big point in favor of: RCM is that it can actually be done relatively quickly. Furthermore RCM frames and correctly positions all these other technologies.
The next question is: Where do we start? Answer: go back to Commercial Aviation. What did they have to do? Answer: doing the right job as well as doing the job right.
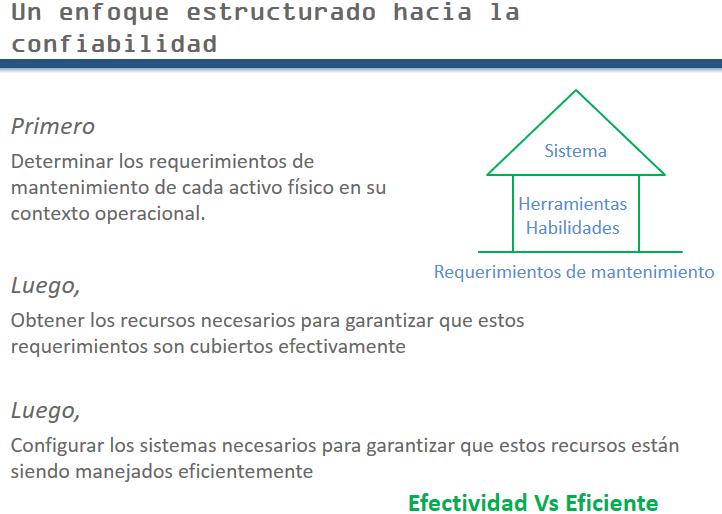
RCM’s structured approach to maintenance
It can be thought of as building a house.
We first need the foundation: representing the maintenance requirements. Then the walls: representing the skills, spares, and tools. Finally, the roof: representing the information management systems, such as the EAM.
Industry has spent millions of $ on the roof. But they went through interminable iterations and updates to get some missing feature, thinking each time that now it will work.
If you spend millions on the roof and only hundreds on the foundation what’s going to happen to your building? The method for building the foundation is RCM.
We are not not insisting here that no infrastructure should be built, but merely pointing at priorities. As a priority, establish the actual maintenance tasks required to sustain needed asset functionality. And we must do so in a comprehensive, yet easily comprehensible format. That exercise will lead us directly to maintenance policy decisions on resourcing and systems.
True meaning of the word “maintenance
As a result of the sweeping changes in the scope of maintenance that we described earlier, people tend to lose sight of the true meaning of the word “maintenance”.
“Preserve” versus “change”
We note that both the Oxford and Webster dictionaries have the “preserve” concept. Furthermore, neither has the “change” concept. What we’re saying is that there is a big difference between “maintenance” and “modification”. It is true that maintenance people often execute one time engineering changes. However, when they are doing so they are not doing “maintenance”. It is important to recognize the distinction. The objective is an on-going, practical maintenance plan. In order to achieve performance, when maintenance is not technically feasible, it is sometimes necessary to make changes to the asset or to its related standard operating procedures.
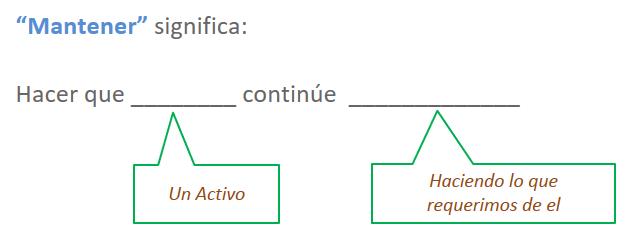
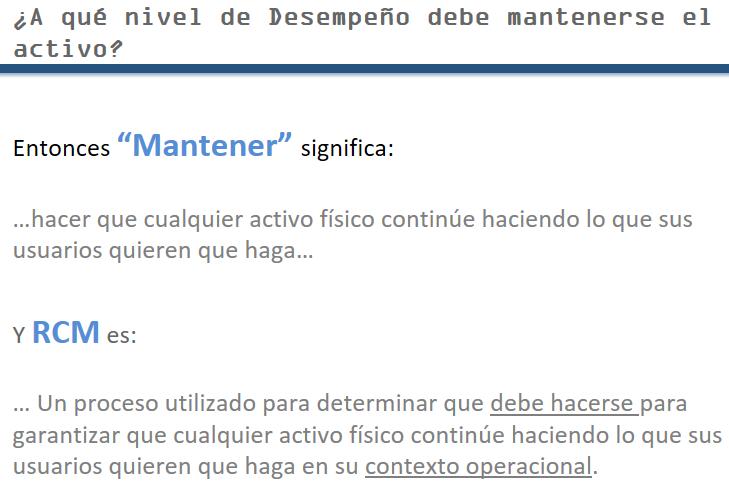
In the context of this course, the word “maintain” means no more no less, than to sustain an asset’s required functionality through scheduled tasks.
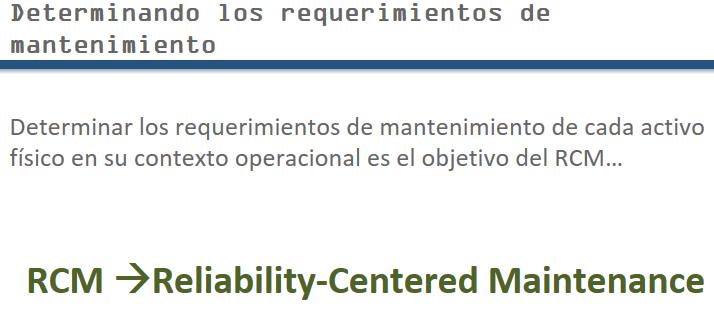
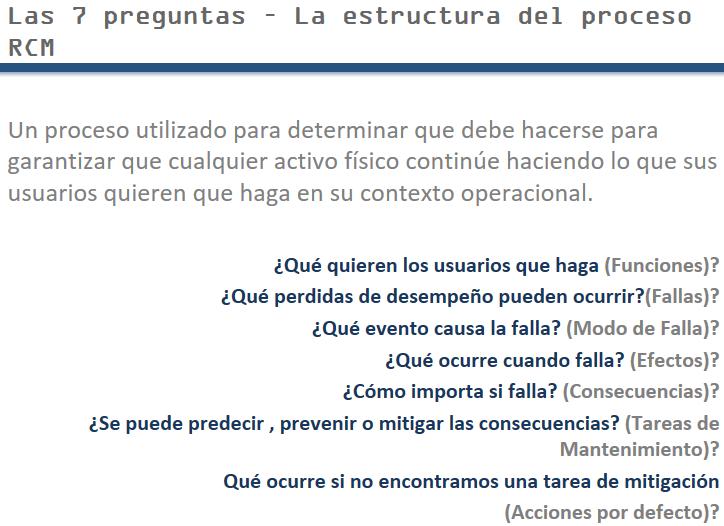
Determining the “What” – is the definition of RCM.
Question: To what level should the asset’s functions be preserved? Some people will say what designer wants. Others will say, correctly “what the user wants”.
To what level of performance should an asset be maintained? How should users determine the level of performance that they want?
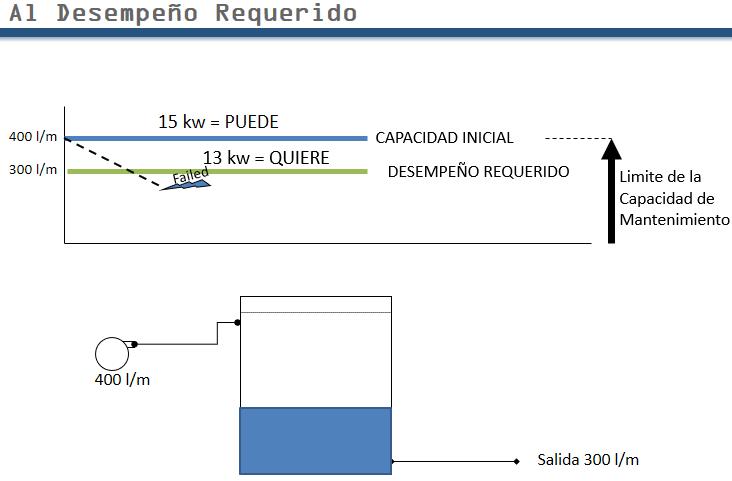
Desired performance graph
This is arguably the most important graph in the entire discipline of maintenance management. If you try to extract 15 kw out of a 10 kw motor, what’s going to happen? No amount of maintenance will make it reliable.
Referring to, first, the “Desired Performance” line, no amount of maintenance will make that system reliable. In almost the majority of cases where there are serious reliability problems, there is a component somewhere which has this problem.
Very obvious here, but out in the field it’s never so obvious. What do we resort to? Redesign?
Desired performance must be within the initial envelope of capability. Why not equal to? Go to another little system which many of you have seen before. pump 400 lpm feeding tank being emptied at 300 lpm Why? 2nd law of thermodynamics. Everything will deteriorate. That’s where we’re all heading, our bodies anyway. Chaos here we come. Our pump impeller will wear.
What does fail actually mean? Easy: No longer performs functions for users. Financial : can’t generate revenue for shareholders – user of company uses it to generate revenue. No longer fulfills a specific function to the level of performance required by user.
How big should the gap be?” Answer: adequate (as opposed to inadequate). It’s getting narrower and narrower. Causing one of our biggest reliability problems. The forces are: 1. desire to reduce the capital investment.
A 2nd force is: The user wants to open the valve a bit more – gets 350. The pump fails twice as often. Double the downtime, halve the reliability. Then the operators say – that pump used to be much more reliable. What’s gone wrong with maintenance? Answer: Nothing.
If you, as an operations manager, really want to see step changes in the reliability of a system, you need to get operators to understand and accept the design limit. And maintainers to understand performance limit. The operator will know that he wants to keep the tank full. He has to tell you his requirements. This is an extremely important concept. It is embodied in the difference between Engineer think <-versus-> RCM think. The engineer thinks it’s good when it looks like it came ootb (out-of-the-box). It is clean and shiny. Engineers try to maintain to initial capability standard. That is an impossible goal. You can restore an asset to its initial capability but cannot maintain it there. The second you start using it you start its deterioration. Any system exposed to the real world does deteriorate, for example, the Canadian senate.
There must be an adequate gap. Value engineering in the 1960s got out of control. For centrifugal pumps – gap is 20-25%. However, if it is much more than that and you start running into efficiency problems. Adequate – When it’s inadequate it becomes obvious. But you must know the user limit and design limit. How do we determine the user’s desired limit? Answer: RCM. Once both parties understand the gap, you start finding some serious performance changes in maintenance because people start to think differently. It’s embarrassing how often you find out that this is the problem.
[Checkpoint around 12:00 first morning. Next few slides – will be show the direction for the rest of the course.]
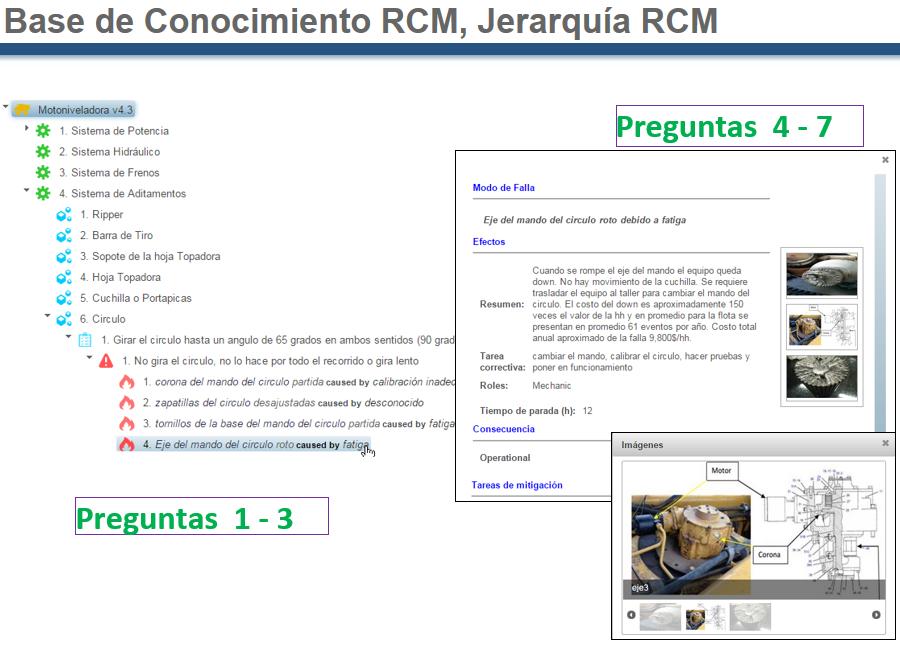
The 7 question backbone of RCM
Functions define the objectives of maintenance for that asset. Each function statement states the performance standards that need to be met.
Failed state: A statement of which performance standard is compromised and the extent to which it cannot be achieved as required.
Failure modes: The event that causes a failed state.
Failure effect: A short story describing what happens if the failure mode event occurs.
A systematic logical process
One may react to this knowledge structure by remarking that this is going to be a lot of work given that there are hundreds of thousands of failure modes in your plant. You might say, “Our job is to produce coal not to fill in documents like this”. Firstly, it’s not quite as much work as it appears at first glance. More importantly there is an inherent desire for a systematic approach to maintenance management, illustrated in the next slide.
Why make the RCM effort
We ask, How many 1st 2nd 3rd line managers have that meeting every day with production supervisors?
What is the principal item that is discussed at those meetings? Answer – what broke, what went wrong.
What they’re discussing is?… Failure modes. For example, drive failed on conveyor. Now the kicker… In the vast majority of cases at what point in time are they discussing failure modes? Answer: after the fact. And discussing after the fact is the essence of what kind of management? Answer – reactive. Not only are you practicing reactive management but you are allowing your failure modes to dictate your agenda. This is a very important point. If you wish to make the transition, you’re going to at some point have to turn your attention from what happened to what could happen. In other words, in performing RCM, we are trying to write a technical history in advance of the events. Analogy: It’s like driving on the freeway only looking at your rear view mirrors. There will be a very high probability you’ll just go from one wreck to another. Conclusion: Yes, it’s a lot of work, but you need to do it.
What about “Prioritization”? often called “criticality analysis”. Which assets should you analayze and in what order? Prioritization is not a part of the RCM SAE standard. Their position is that that the criticality assessment process is industry specific. There is a grid based methodology that allows the configuration of factors for probability and severity. The method is outlined in various military RCM standards, available on the Internet, which users usually adapt for their industry.
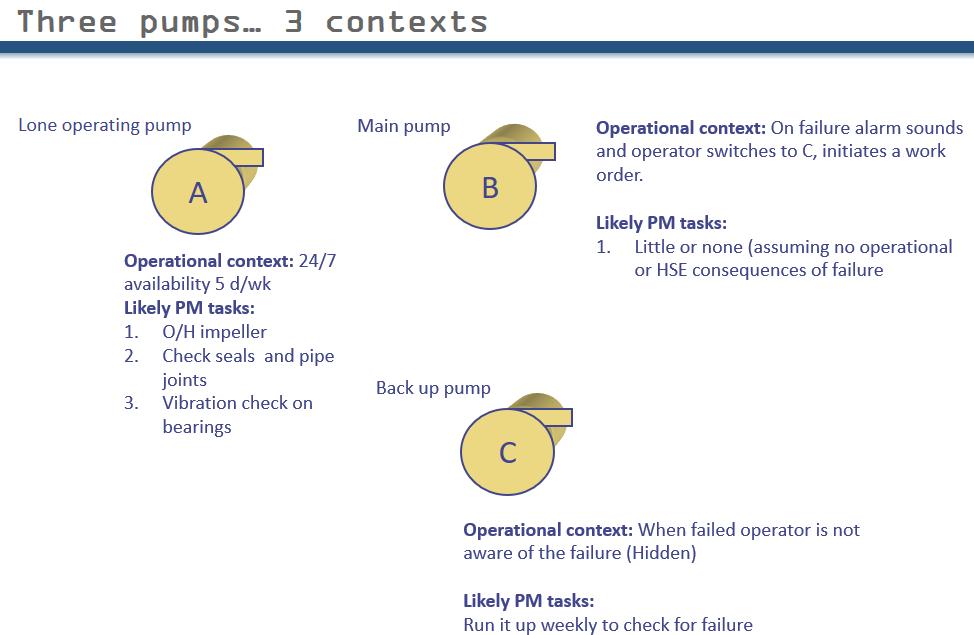
Operating context
We go back to this slide many many times. Another important slide follows. A huge unfreezer. The classic 3 pumps. 80% of your delegates won’t have heard this one. Sequence of following is important. 3 identical pumps: same liquid, same head, same coupling, same piping config, same control, same external environment. All came from same manufacturer. Where do we turn for the maintenance information? Answer the manufacturer’s operating manual, drawings, and maintenance recommendations.
Question: Is mfgr going to give us 3 different maintenance programs? A: He will say a pump is a pump is a pump. Same attitude in traditional PM programs. Consultants used to teach that you write a program for one machine, then roll it out to all the other machines. Now I’m going to give you one more piece of information on each pump:
A – is a stand alone pump
– its failure affects operations
– so we’re likely to undertake some form of PM. Replace impeller, check seals, vibration monitoring of bearings. A good solid PM program.
B – is duty that works in the presence of a backup pump C
C – is a standby pump backing up B if it fails.
What’s so clever about that? Answer: Nothing. But when you get taken on that inevitable plant tour. (Grits teeth. After 7th or 8th power station.) When you pass a pair of pumps A and B. Ask which of these pumps is the most important. 90% will say B without a second’s thought. Where are they going to put their effort. What’s C? A cheap source of spare parts.
In fact we asked the wrong question. “Which pump matters the most?” We should have asked – “In what way does the failure matter?” So what if B fails – we switch to C and repair B. If that is the only consequence what maintenance program would we seriously consider? (note careful choice of words) Answer: run to failure. Key point – that is what you guys are telling me. You are telling me that identical pumps can have vastly different maintenance programs.
What happens if pump C fails while B is still working? Answer: Operators will not be aware that it is in a failed state.
What are we going to do from time-to-time? Answer: check if it has failed? (We’re not prescribing this.)
So-what point – C’s task is completely different. Not immediately obvious.
Final “so what”: 3 identical pumps with completely different maintenance programs.
B – Duty – switch to C and repair. RTF
C – stand-by to B – check if it has failed.
What about alternating B and C? Which is better duty/stdby versus alternating? First point, RCM does not have a stock answer on that subject.
All RCM asks for is that you make a clear distinction of how you are operating. You need a clear operating policy to have a clear maintenance policy.
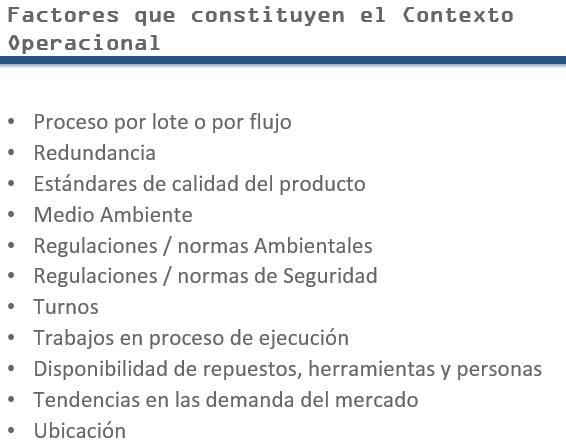
Factors that influence operating context
The operating context should be kept in mind and referred to during the Effects and Consequences analyses. This is not an exhaustive list.
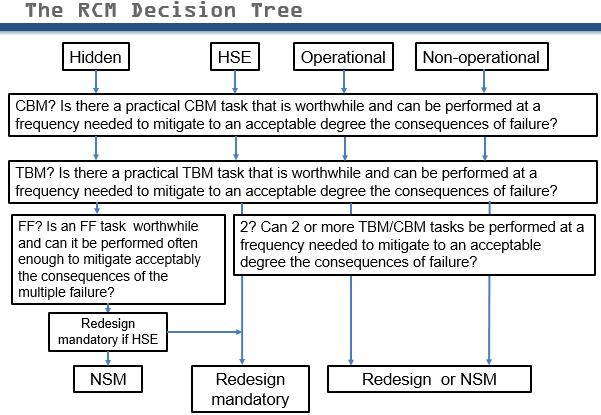
The RCM decision tree
What is the logic of left most branch? We test for the applicability and effectiveness of proactive maintenance. In most cases we drop through to “failure finding”. The second branch deals with failure modes whose consequences are health safety and the environment (HSE) related. What is distinction between hidden and safety? In branch one we’re talking about the fire alarm. In Branch 2 we’re talking about the the event that causes the fire. We consider (in this version of the RCM decision tree) that health, safety and environment are a single category of consequences. Branches 2, 3 and 4 are easily understood.
The RCM Facilitator can use this guide to make sure that the RCM question and answer process is followed without skipping any steps. RCM software should not get in the way of the RCM thinking process. The facilitator’s role is to keep the participants’ imaginations fully engaged in the process by asking the RCM questions. All conceivable failure modes for example “safety valve removed” (Piper Alpha) should be considered for inclusion in the analysis.
[1]Reliability Analysis is the chronological exploration of an item’s failure and maintenance events in order to understand and model the item’s failure behavior. RA was called “age exploration” by N & H and actuarial analysis by John Moubray. With the realization of the value of on-condition maintenance RA today includes the analysis of reliability as a function of age and significant condition monitored data.↩
[2]An Introduction to the US Naval Air System Command RCM Process and Integrated Reliability Centered Maintenance Software http://www.omdec.com/wikifiles/jcLeverette.pdf way of executing an RCM analysis.↩
[5]Strangely, multiple failures inside the blow out preventer were not the cause of the failure of this last line of defense. The BOP could not operate properly to shear and block the drill pipe because the drill pipe had bent due to the enormous differential pressure between annulus and the drill pipe interior. This phenomenon is called the “compression effect”.↩


 Loading…
Leave a Reply
You must be logged in to post a comment.