We automate a decision process because we don’t want to make day-to-day decisions each time from first principles. There aren’t sufficient human resources available in the Maintenance Department to eyeball every graph of condition monitoring data and every work order comprising an item’s maintenance and failure history. Yet these databases are generally believed to hold the “secrets” of when and where the next failure will occur.
What is the recurring decision in maintenance? What decisions do we make scores of times a day consciously or unconsciously as new information reveals itself and data accrues? For each system all action decisions repetitively boil down to one of three choices:
- Should we intervene immediately and perform a specified task?
- Should we schedule a particular maintenance task for some time in the next few days, weeks, or months?
- Should we defer the decision until the next observation of the monitored data?
Given the repetitive nature of failure and its consequences, it is reasonable to surmise that our knowledge of the patterns of data preceding failure can coalesce into a rule or model for decision making. EXAKT converts condition monitoring and Event data into a model used in an automated decision process.
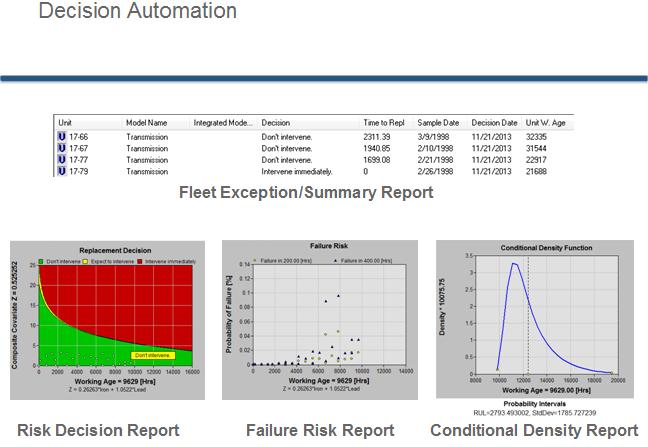
The figure illustrates two levels of reporting generated by the EXAKT decision agent. The agent monitors data continuously as it unfolds, that is, as each new record arrives into a variety of databases. The upper table, “Fleet Exception/Summary” appears in the CMMS as an exception report. The model generated decision (column 4) derives from an item’s calculated failure probability, its remaining useful life, and the consequences of its failure.
One drills down to the second level of reporting whenever the summary flags an exception, for example as in line 4. The graphical reports underlie the Exception/Summary report. Each graph conveys information regarding the automated decision. The leftmost graph combines the business factors with failure probability highlighting the recommendation as a red, yellow, or green indicator. The center graph provides the item’s failure probability within a future time horizon of 250 and 500 age units. The third graph conveys the Remaining Useful Life Estimate (RULE) and confidence (standard deviation) we may hold in the reported RULE.
- Automating CBM (92.7%)
- Measuring and Improving CBM Effectiveness (87.4%)
- Components of continuous improvement (19.9%)
- EXAKT cost sensitivity analysis (19.9%)
- Thoughts from a mine maintenance engineer (19.9%)
- LRCM reliability analyst survey results (RANDOM – 7.3%)