One point of discussion is the role of high level (lagging) KPIs. In mining, over the last decade, given the unrelenting world demand for resources, the KPI of greatest concern has been Availability, almost to the exclusion of other considerations.
This view can falsify conclusions about real maintenance performance. One example concerns the shovels which are the most critical equipment. We pull out all stops to make sure their availability remains high. There is even a tendency to delay scheduled maintenance where it would introduce downtime. To compensate we have maintenance teams at the ready, to perform corrective maintenance quickly in the field on demand. In this way availability and maintainability can remain “artificially” high.[1] Good Availability numbers may be achieved, but at the expense of reliability, efficiency, safety, and economy. On the other end of the spectrum are the bull dozers. That would be because their PMs are performed religiously. Perhaps the equipment is even being over maintained. As a result the Dozers show great reliability and low maintainability.
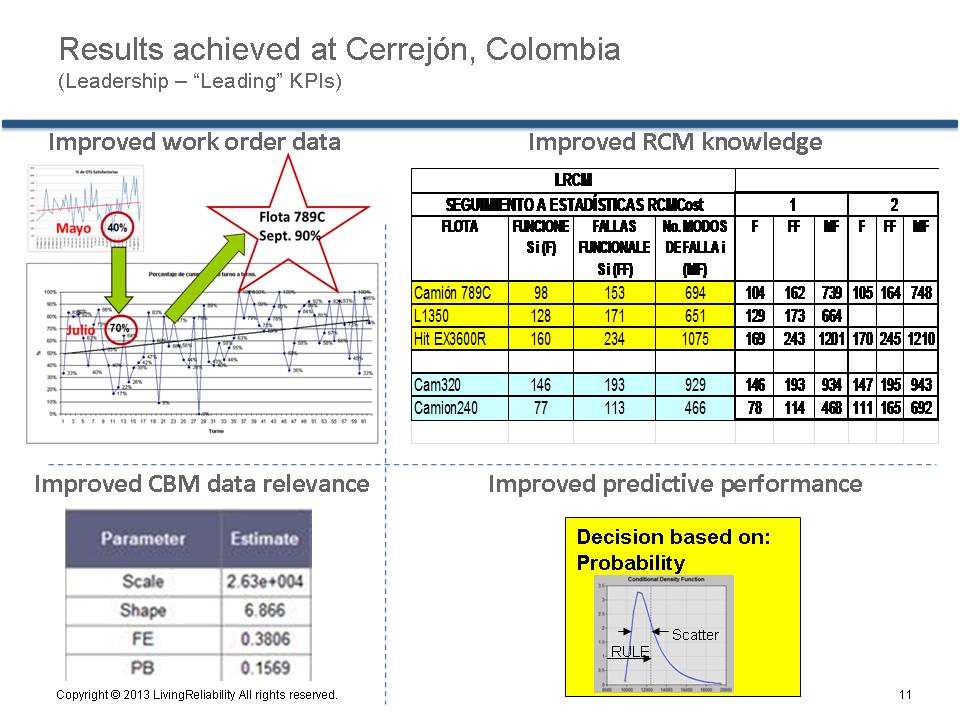
Our evolving discussion of these considerations, as we explore and implement LRCM principles, point increasingly to the need to track and examine the low level (leading) KPIs. These would include numbers such as the rate of day-to-day growth of RCM knowledge, the quantity of samples generated and number of analyses performed, number of comments and RCM update recommendations received from the field, and so on. In other words, the indices over which we have direct control.
I am convinced that we will find the golden fleece one day soon. That will be when we, as managers, can look at the low and high level indicators simultaneously and understand the complex relationships between them. Then Management will be better placed to do their job, which is to inject maintenance energy optimally into the activities that they know will increase profitability.
We might say that the “art” of management is to select, measure, and promote the “right” leading KPIs that the Manager believes will drive the ultimate or “lagging” metrics of profitability and safety.
- [1]We’re not arguing that a run-to-failure policy based on long practice for critical equipment is necessarily wrong. Only that it should be validated with data. And possibly that the mix of reactive and proactive effort be optimized↩