The following is a quote from a well known consultant:
The biggest problem we have is lack of data… The data we do have in most cases is subject to different conditions as well. So if I have managed to collect 10 failures of a pump in 15 years, I am unlikely to be able to determine anything with much confidence. That is my point. Now if I have hundreds of components – let’s say light globes that turn on and off on the same cycle, then I have lots of data and can use it – trouble is we usually have one of everything and data is so scarce we can’t use it. Nothing at all to do with the method or the assumptions applied.
The foregoing argument is often made by RCM consultants responding to the general lack of success in achieving verifiable reliability improvement from data.
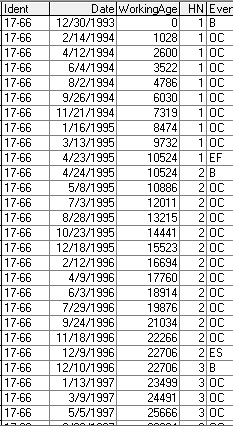 In the table at the left is some age data collected over about 3 years in a very small fleet of four haul trucks. An optimal CBM decision model can indeed be drawn from this relatively scant amount of data. (Not shown is the CBM data prior to and concurrent with these events.) Most fleets contain 20 to 80 trucks and more. Hence abundant good age data can be acquired. [1] This table refers to transmissions that failed (EF = ending by failure) and transmissions that were rebuilt because their overhaul interval timed out (ES = ending by suspension). The transmissions whose lives were suspended, according to the technician’s observation. still had an indefinite amount of life left in them. Reliability analysis handles the uncertainty (of when the suspended transmissions would have failed) properly. The events labeled “OC” are oil changes.[2]
Now let’s look at the optimal maintenance decision model[3] and its cost benefit analysis drawn from this meager data set:
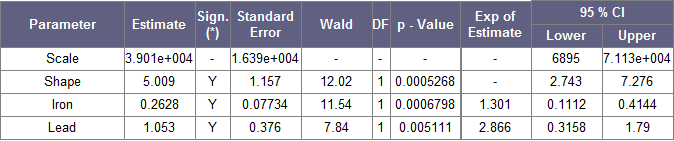 The Proportional Hazard Model result table to the right tells you that the extended Weibull shape parameter is “Significant” (indicated in the third column as “Y” for yes). In other words the item’s age is a significant risk factor. The results also tell you that Iron and Lead are statistically correlated with failure. Furthermore the degree or strength of the correlation is indicated by the parameter “Estimate” in the second column. Various statistical test results in the other columns support the reliability model’s findings.
Next we add a predictive model built from condition data transitions occurring over the time period. Finally we add the relevant business data, specifically the cost of an unplanned failure relative to the cost of of overhauling the transmission preventively. The the model’s expected performance is given in the following table:
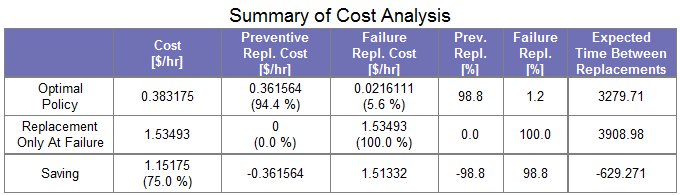
The above analysis tells you that, if you adhere to the optimal CBM policy (shown visually below as a red/green/yellow graph) by intervening when the transmission is in the red (potential failure) state, the savings related to that failure mode will be $1.50 per hour, 75% better than a run-to-failure or a poorly executed non-optimized CBM program.
The final images complete our appreciation of the value of acquired age data (suspensions and failures):
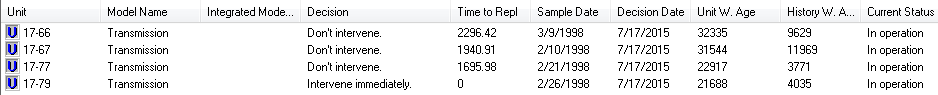
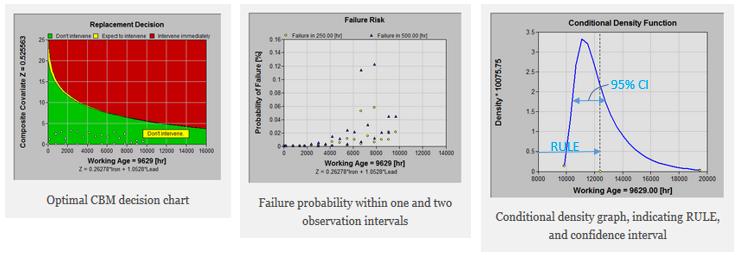 The top tabular report provides a Remaining Useful Life Estimate (RULE) for the transmissions of the fleet and an optimal recommendation. Drilling down we can view the red yellow and green optimal replacement decision graph. And the graph on the bottom right tells us the predictive confidence which is reflected in a predictive performance KPI.
Conclusion
While it is arguable that the “biggest problem” for reliability analysis is the lack of good data this shortcoming is not intrinsic to the nature of failure, nor is it an insurmountable problem. The single obstacle[4] to data driven decisions in maintenance is a lack of use of the EAM system’s capability to track, with accuracy, a part’s working age so that it is known at failure or suspension. The Living RCM method for work order completion taps this vital EAM data capability and generates samples of life histories useable for reliability analysis, optimal decision modeling, and remaining useful life (RUL) prediction.
- [1]Even where assets are one of a kind rather than in fleets careful discrimination using LRCM methods when reporting instances of suspensions and potential failures will often still yield good samples for reliability analysis and decision modeling. This is true because, for purposes of reliability analysis, a functional failure is not required. A “potential failure” discovered during overhaul, PM, or following a CBM warning is considered to be an actual failure.↩
- [2]Oil changes are a class of event referred to as “non-rejuvenating” events. These may include any event which will affect or reset the CBM data but does not add any life back to the physical asset. The reliability engineer identifies these events in the software if he believes they could mislead the algorithm. By knowing that a non-rejuvenating event occurred, less weight will be assigned to low values of the data following the event when determining the probabilistic relationship between condition data and failure.↩
- [3]The Cox Proportional hazard model, Markov failure time model, and failure-prevention cost differential business parameters combined in the EXAKT™ software application.↩
- [4]There is another presumed obstacle cited by some RCM practitioners who hold the view that data analysis is of questionable value. This view derives from the Resnikoff conundrum discussed in John Moubray’s book RCM II (pp 252-253). Resnikoff argues that serious failures would have been designed out at their first occurrence, hence there will never be an adequate sample for “actuarial” analysis. This flawed conclusion ignores some important truths. First, the renewed components that have not failed still contribute to the analysis. The analytic procedure counts these renewals as “suspended lifetimes”. The failure probability computation accounts for the suspended part or failure mode as having survived at least that long. Secondly, reliability analysis procedures such as Weibull count potential failures as imminent failures for the purpose of developing an age-reliability relationship. Because potential failure consequences can be mitigated by maintenance, they would not necessarily be designed out. Finally, most preventive maintenance is actually condition based in the sense that an inspection is conducted, the result of which prompts a maintenance action that confirms whether a potential failure has indeed occurred. A CBM decision policy emerges from a multi-dimensional actuarial analysis that combines PM inspection results with the age of the part and the relevant condition monitoring data. The predictive model calculates a remaining useful life estimate (RULE). This subject of predictive maintenance decision confidence is discussed in the article https://www.livingreliability.com/en/posts/confidence-in-predictive-maintenance/ ↩