The article Take the EAM data health check provided maintenance engineers with a form for submitting their CBM[1] and EAM data for assessment of its predictive decision support capability. In this article we’ll describe the methods we use to scrutinize the data and report on its analytical potential.
Graph of CBM data and events
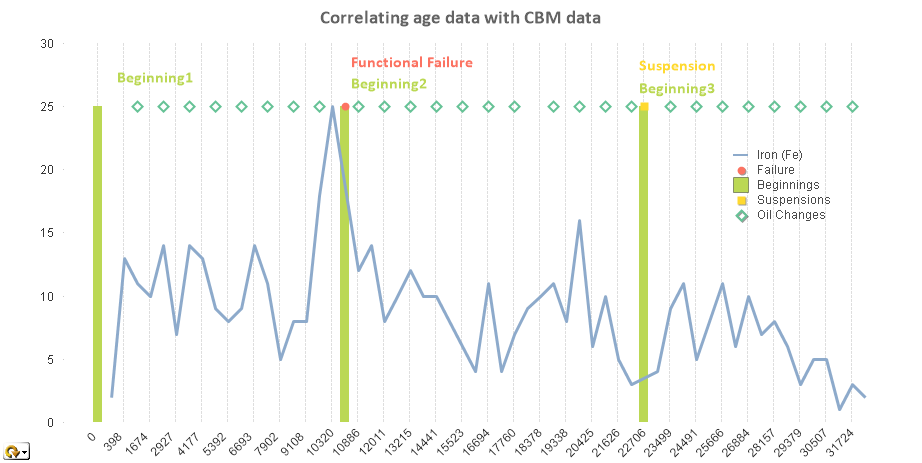
The graph on the foregoing data health dashboard presents a data perspective that is rarely seen in the maintenance technology world. It is a unified view of CBM data and EAM work order data together for the first time. On this graph we can witness CBM data preceding each past failure or potential failure event as they were reported on a work order. This graph represents the main input to the proportional hazard model equation (PHM) described next.
The PHM shape (age) parameter β
The dashboard displays the age or shape parameter β[2] from the PHM equation:

where  is the failure rate function, β>0 is the shape (age) parameter, η>0 is the scale parameter, and γ =( γ1,γ2,… γm,) is the coefficient vector for the condition monitoring variable (covariate) vector Z(t).
The first factor  on the right hand side of the equation is recognizable as the Weibull hazard function. We can see that if β is large the item’s age t will have a large influence on the probability of failure. On the other hand if β is small, say around 1, it is the second factor containing the significant CBM variables that will predominantly determine failure probability in an upcoming period of time.
Since age is really a dilute mixture of the influence on failure by other risk factors it is usually a poor predictor. Hence we would like age to be a small player in our CBM decision. And we would like the influence of condition monitoring variables to be large. It turns out that the principal cause of a large β parameter is poor quality data recorded on the EAM work order. When suspensions are misrepresented as failures and failure modes are not consistently identified on the work order the PHM numerical computation will result in a large β. In other words the CBM task reduces to a TBM task.[3] The second reason for a large β, provided work order data is accurate, is that we are monitoring the wrong variables, those that are not strongly related to the failure mode’s degradation process.
Either way β is a telling indicator of the health of our data oriented maintenance procedures.
The standard deviation σ about the RULE
The conditional mean time to failure (CMMTF) is like the MTTF except it is measured from the current moment. That is why it is also known as the remaining useful life estimate or RULE. As is the case with the MTTF, the predictive value of the CMMTF is reflected by the amount of scatter or standard deviation. This idea is expounded upon in the slides below.
The standard deviation then is an excellent indicator of the predictive performance of predictive maintenance policy applied to any given asset. The standard deviation, which is another indirect measure of work order data accuracy, is, therefore, also reported on the EAM data health dashboard.
- [1]CBM is also known (with varying nuances) by the names “on-condition maintenance”, “predictive maintenance” (PdM), “condition monitoring” (CM), “prognostics & health management” (PHM), “equipment health monitoring” (EHM), or simply “preventive maintenance (PM) inspections”. It is the gathering, processing, and analyzing of relevant data and observations, in order to make good and timely decisions on whether to:
1. Intervene immediately and conduct maintenance on an equipment at this time, or to
2. Plan to conduct maintenance within a specified time, or
3. Continue operating the equipment deferring the decision until the next CBM observation.
↩ - [2]located in the Weibull baseline portion of the proportional hazard model equation↩
- [3]We’re referring here to model based decision making. If the decision model has a large age influence, and a small amount of condition indicator influence CBM will have been “defeated”. See the article Defeating CBM.↩
- Defeating CBM (59%)
- Structured free text (54.7%)
- LRCM reliability technician survey results (39.4%)
- Failure probability prior to attaining MTTF (32.8%)
- Failure declaration standards (26.2%)
- CBM Optimization (RANDOM – 6%)
[…] ← RCM planning sheet. How to assess EAM and CBM predictive capability → […]