EXAKT modeling application
You will learn the basic functions of the EXAKT model building software and the EXAKT decision agent software. You will use a reduced set of oil analysis data from a fleet of haul truck transmissions to build a proportional hazards model. Then you will deploy this model as an “intelligent agent” that silently and automatically monitors future condition monitoring data, returning an optimized decision (whether or not to remove and repair the transmission) as each new set of condition monitoring readings are received.
A long term policy of making optimized decisions will, on the average, minimize some undesirable feature, such as cost , or maximize some wanted feature, such as availability. The agent provides a remaining useful life estimate based on the current condition of the equipment, its age, and all relevant maintenance and operational events that have occurred.
Download the data and place it in it’s own folder, say \Example
Launch the application
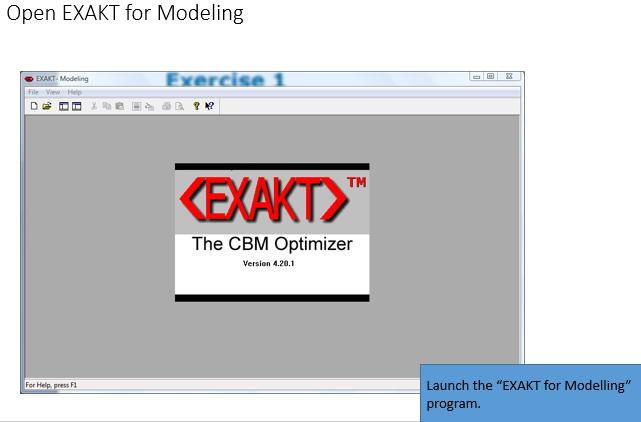
Launch “EXAKT for Modelling”. This is the program for validating and analyzing condition monitoring and event data and for building the optimized CBM (condition based maintenance) model.
Create a working database for building the model
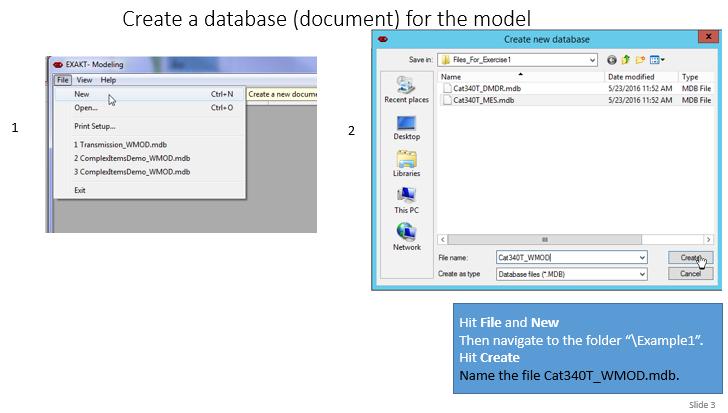
A “model” refers to a failure mode, for example, as identified in the RCM knowledge base. Specifically a CBM model describes a failure mode’s behavior as a function of its age and significant monitored variables. The working model database, in this case Cat340T_WMOD.mdb, will typically contain a number of models each corresponding to a failure mode identified in the RCM analysis, and whose consequences we intend to mitigate by CBM.
A decision model uses probabilities as well as business factors to optimize the CBM decision wit an objective in mind, for example, maximizing the equipment’s availability.
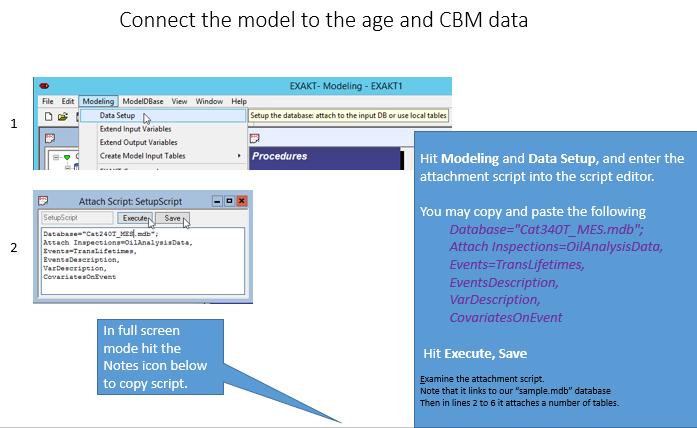
Connect the data
Data exists in a variety of databases. A query language script is used to connect the modeling application to the data. The data may be in a local folder, in a corporate database, or in the cloud. The location of the data found to be relevant will be embedded in the final deployed model so that it is independent of the modeling software.
Database="Cat340T_MES.mdb";
 Attach Inspections=OilAnalysisData,
 Events=TransLifetimes,
 EventsDescription,
 VarDescription,
 CovariatesOnEvent
Examine the above attachment script. In line 1 link to an external database called “Cat340T_WMOD.mdb”. Then it “attaches” a number of tables in that databas. It has applied its own internal names to two of the tables using the A=B syntax but other tables are attached directly since their names are consistent with EXAKT’s internal names for those tables.
Notice that the attached tables have now become visible and accessible in the tree view in the left window pane. In the next steps wewill examine each one of those tables to become familiar with their content and structure.
The data used for modeling
The Inspections table
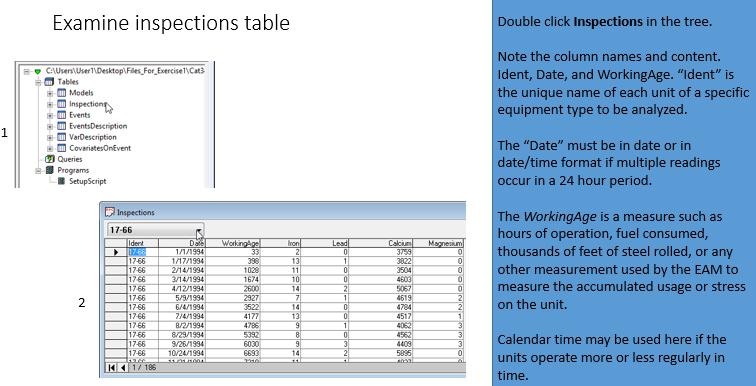
Open the Inspections table by double clicking on it. Note the column names and content. Ident, Date, and WorkingAge are key words used by EXAKT. “Ident” is the unique name of each unit of a fleet or type of Item.
An item can be a significant system, subsystem, or component. An item can be subject to one or more failure modes. We conduct reliability analysis on an item to determine the failure behavior of its significant failure modes. We adhere to the RCM definition of a failure mode as a part (or assembly of parts) and its deterioration mechanism.[1] In this tutorial we’ll keep it simple and assume that the item is a “simple” item with a single or dominant failure mode, namely “Transmission fails”.
The “Date” may be set up in date or in date/time format. If condition monitoring inspections are more frequent than once every 24 hours, the date/time format must be used. The WorkingAge is a measure such as hours of operation, fuel consumed, thousands of feet of steel rolled, or any other measurement that reflects the accumulated usage or stress on the item. Calendar time can only be used if the units operate more or less regularly in time – a rare situation in some industrial or military sectors. Where necessary databases of production records, hour meters, or counters must be linked to calendar dates in order to acquire useful WorkingAge data. The remaining columns contain the condition monitoring data which we refer to as condition data.
The Events table
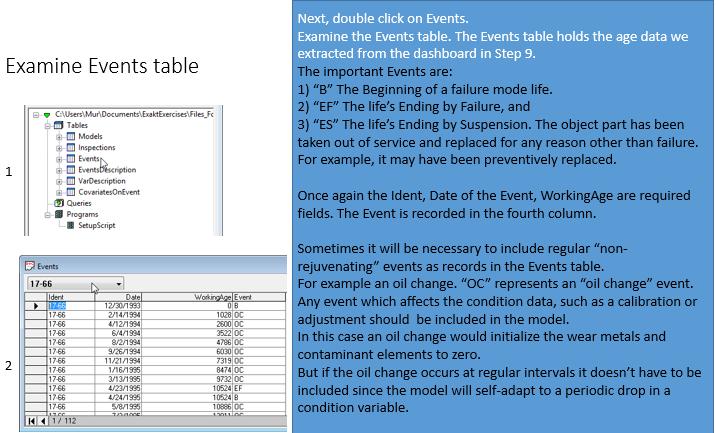
Contrasted with the Inspections table, the Events table represents the other side of the coin. Both Event and Inspection data are required for CBM optimization. The EXAKT modelling process is one of correlation of Events (of all kinds) and Inspections (condition data).
The Events data comes from the organization’s EAM as recorded by technicians on maintenance work orders. EAM work order observation recording procedures have been less rigorous than CBM data procedures. Required Events are: 1) Beginning (an item has been placed into service) designated by B. 2) Ending by Failure, (EF)and 3) Ending by Suspension (ES). By “suspension” we mean that the part (or component) has been taken out of service for a reason other than failure. For example, it may have been preventively replaced.
Once again the Ident, Date of the Event, WorkingAge are required fields. The Event itself is recorded in the fourth column. “OC” in this example represents an “oil change” event. Any event which affects the condition data (in this case it would initialize the wear metals and contaminant elements to zero) must be included in the model.
Examine the the other tables
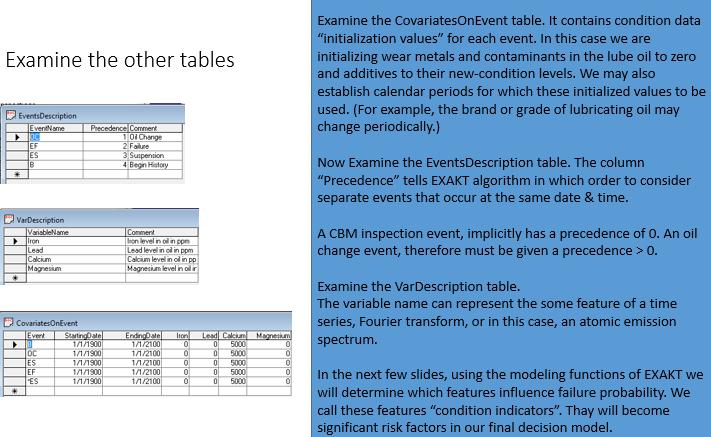
Examine the CovariatesOnEvent . We must provide the “initialization values” for each event. Note that in this case we are initializing wear metals and contaminants to zero and additives to their new-condition levels. We may also establish calendar periods for which these initialized values to be used. (For example, the brand or grade of lubricating oil may be changed periodically.)
Examine the EventsDescription table. The column “Precedence” tells EXAKT program in which order to consider separate events that occur at the same date/time. For example, if an oil sample is drawn from an oil drain, we would wish that the sequence of the Inspection precede that of the oil change. The inspection event is implicitly given the precedence “0”.
Examine the VarDescription table. The variable name can contain the symbol or text associated with some feature of a time series, Fourier transform, or in this case, an atomic emission spectrum. Finding features that reflect the state of a failure mode is the purpose of techniques generally called “signal processing”.
Models table
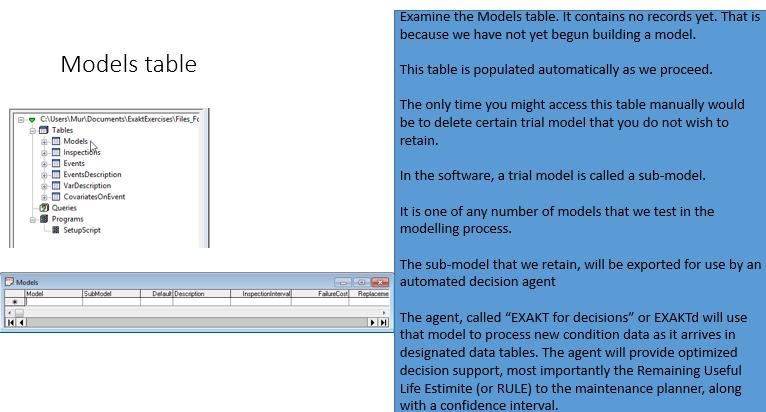
Examine the Models table. It contains no records yet. That is because you have not yet begun building a model. This table is populated automatically by EXAKT as you proceed. The only time you might access this table manually would be to delete certain sub-model(s) that you do not wish to retain. A sub-model is one of any number of models that are tested in the modelling process. The sub-model that is considered the best, is then exported. An agent will use to provide optimized decision support based on a particular item’s current condition data.
General project data
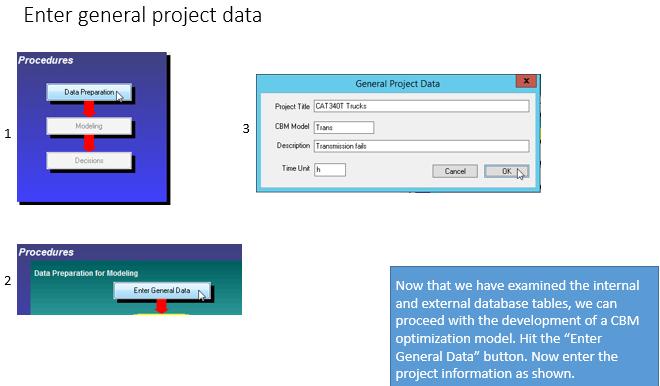
Now that we have examined the internal and external database tables we are ready to proceed with the development of a CBM optimization model. We turn our attention to the right hand window pane containing buttons arranged in a flow chart of activities. We enter the general project data. The project title is usually the name of the item type or fleet, in this case “CAT 340T Trucks” subject to a number of failure modes.
Work order and CBM data integration
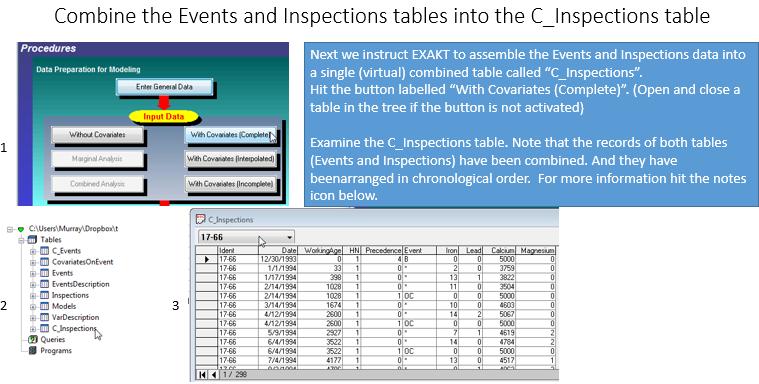
The algorithm will use the combined table called “C_Inspections” for its RA calculations. There are a number of alternative buttons we may hit at this point. For this exercise please hit “With Covariates (Complete)”
Examine the C_Inspections table. Note that the records of both tables (Events and Inspections) have been combined and arranged in chronological order in the single table C_Inspections . Inspection (condition monitoring) record events are designated by an *. The other event records (B, EF, ES, OC) have monitored data (covariate) values set to their initialized levels according to the CovariatesOnEvent table discussed previously.
Modeling
Trial model with 4 CBM variables
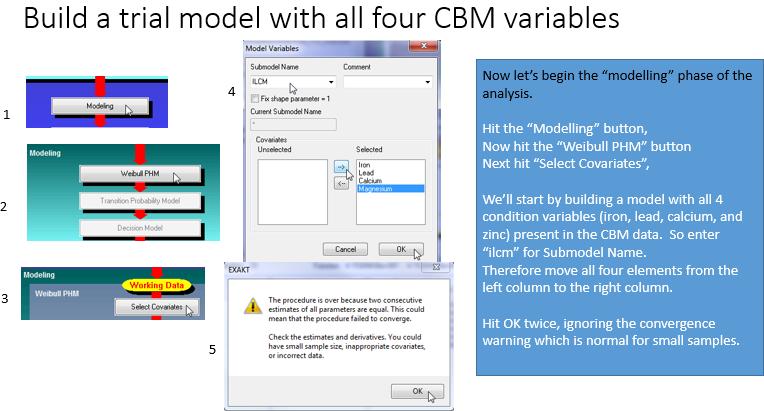
We’ll discover the features that are significant risk factors. Relevant data will result in confident decision making. EXAKT will determine the predictive capability of your condition monitoring data. The maintenance engineer begins by testing the condition data that he believes may be influential to failure probability. He uses EXAKT to systematically home in on the best data to use in the model.
The parameter estimation report
The “Summary of Events and Censored Values” presents the overall summary of the data being analyzed. A “Sample Size” of 13 means that there are 13 histories or lifetimes having a beginning and some kind of ending event.
Of the 13 histories 6 ended in failure, 3 (Censored (Def)) ended prior to a failure, and 4 (Censored (Temp)) units are currently in operation at the time of building this model. They are referred to in EXAKT as “temporary suspensions” and are identified automatically by the software. The next tabulation “Summary of Estimated Parameters” provides the results of our first sub-model “ilcm”. The column whose heading is “Sign.” indicates whether a “Parameter” shape β, or covariate parameter γi is significant – that is, whether it has been found to be statistically related to failure.
The Shape (i.e. WorkingAge), Iron, and Lead are designated as significant (at this point in the analysis) while Calcium and Magnesium are not. Note that Magnesium has the highest Wald Test p-Value. (The Wald Test is used to test if an independent variable has a statistically significant relationship with a dependent variable. The p-value represents the relative probability that Magnesium has no significant impact on risk of failure). Using numerical methods the software estimates the PHM model parameters.
Model with all significant variables
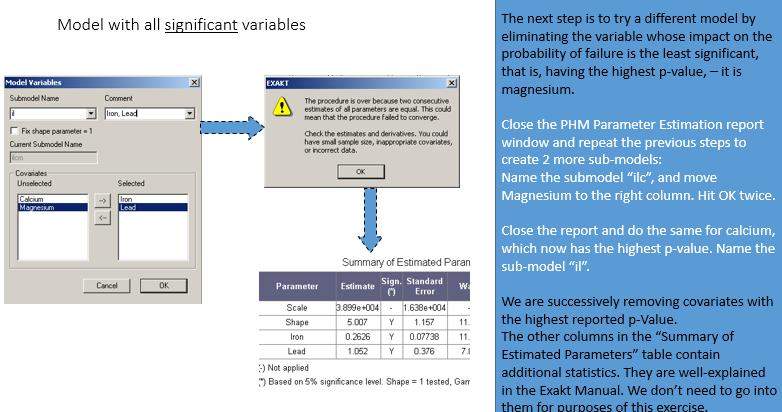
In an iterative process we use EXAKT to find the best model, i.e. containing the most significant factors. The objective is to develop a set of models tailored to each failure mode meriting condition monitoring for the purpose of maintenance decision optimization.
A sub-model with a single variable
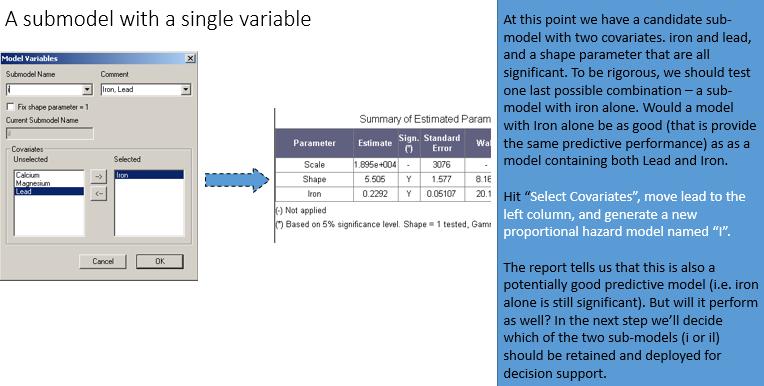
We desire the simplest model, that is the one containing the fewest variables, but that still contains the full predictive capability of more complex models. In this trial we’ll test a model with Iron alone. We’ll use the “deviance” comparison analysis (comparative report) in EXAKT to see if the simple model is as good as the more complex model containing both Iron and Lead.
Comparative report
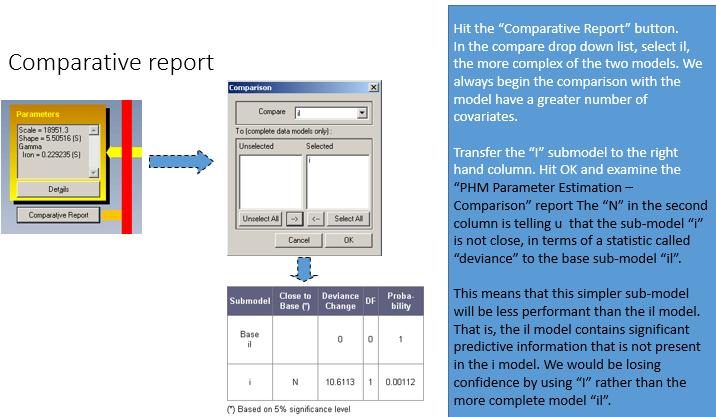
This tool is quick to use and will help to understand better the relationship of condition data to failure mode probability. The maintenance engineer’s goal is to get better and better models. Should a particular failure mode merit an additional investment in acquiring another condition indicator, the software will assist in discovering the data that will contribute most to predictive performance.
Reactivate the retained model
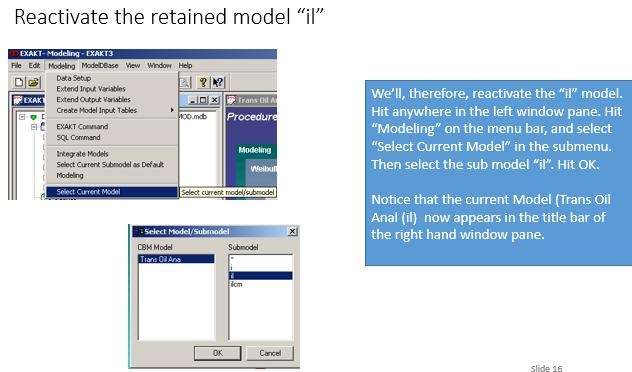
Having rejected the simple “i” model we will revert the the “il” model as the PHM upon which to build our ultimate decision policy. In Step 12 of the post “Mesh – 12 steps to achieving reliability from data” we describe a method in EXAKT for continuous verification and improvement of the model.
Acceptance of the PHM
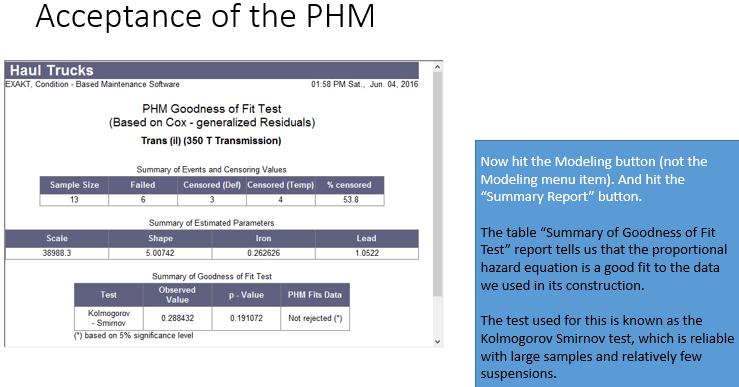
In a continuous improvement program we use a variety of tools to assess predictive performance. As work order information quality improves we will expect to see better statistical evidence generated by EXAKT to measure the improvement with respect to both leading and lagging KPIs.
Transition probability model
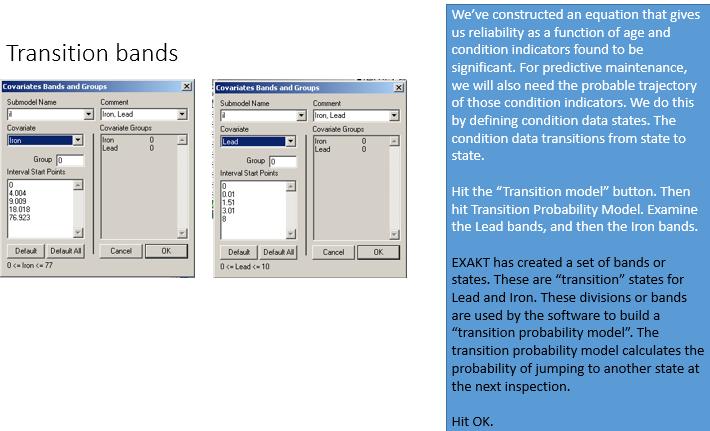
The next component in building our final decision model or policy is the predictive component. While the PHM provides the relationship between condition data, age data, and failure probability, we still need add the predictive capability. This is done by analyzing the patterns of changes in CBM data in the past. Which patterns at a given moment are predictive of a future pattern. The Markov transition probability model provides such a predictive procedure.
Transition probability matrix
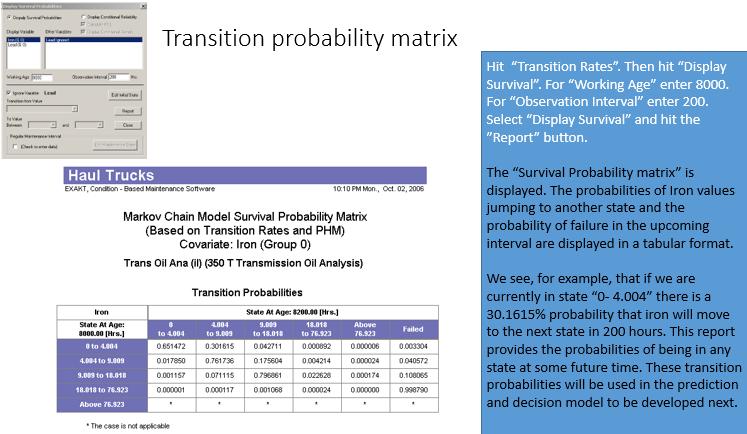
Notice that the two buttons “Display Matrix” and “Display Survival” have become active. Let’s examine the Display Survival function report. Set WorkingAge to, say, 8000 hours, and Observation Interval to, say 200 hours. (assuming, for example, that our asset is currently at age 8000 and we are interested in knowing its risk of failure in the next 200 hours.) The “Markov Chain Model Survival Probability matrix” report is displayed. The probabilities of Iron values jumping to another state and the probability of failure in the upcoming interval are displayed in a tabular format.
(This table represents only a part of the entire set of transition probabilities taken into account by the model. We have chosen to ignore the other significant covariate, Lead in this report. To include more than one covariate in the visual report would require the representation of multi-dimensional matrices. Instead this report allows us to see how a single variable changes irrespective of the others.) Looking at the table we see, for example, that the cell “0- 4.004” and “4.004-9.009” has the entry 0.301615. This means that there is a 30.1615% probability that iron will be in that state at the next monitoring interval. Hence this report provides the probabilities of being in any state at some future time. (Of course, this report is provided for analysis purposes only while building the model. The transition probabilities are fully integrated into the final decision model that will be deployed in section 2.)
Business decision parameters
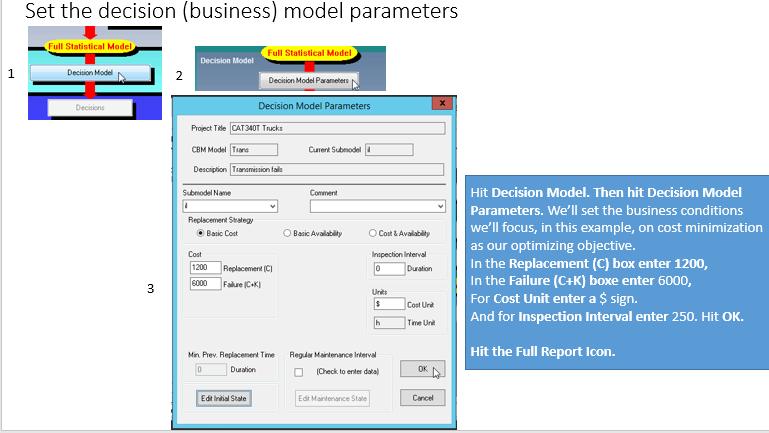
Now for the final step in developing a decision optimization model. We blend into the model the economics governing the failure and repair of this item. In most cases precise relative costs and failure cost penalties are not required. The software provides a sensitivity analysis function to determine whether greater precision in the business data are required.
Business analysis
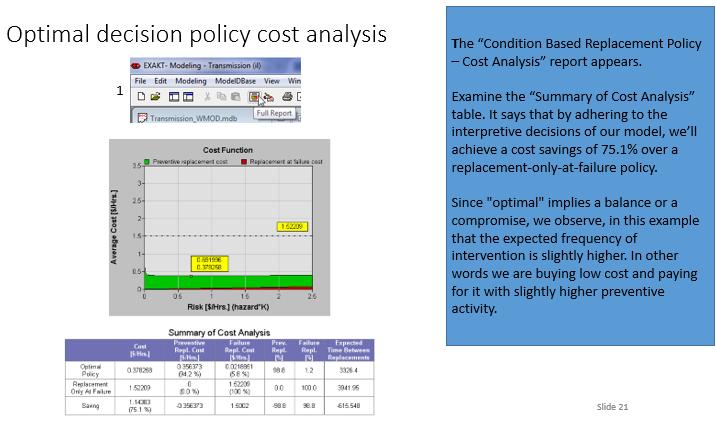
The analysis that automatically appears once the business parameters are added to the evolving decision model compares cost, reliability, and availability achieved by a run-to-failure policy with the EXAKT policy that would have been achieved had it been applied in the past. In many operations where PM is not optimal, this analysis is a fair indicator of what the proposed policy will achieve in the future. In subsequent periods we can use the software to track evolving performance in terms of cost, downtime, and enterprise profitability.
Testing the model
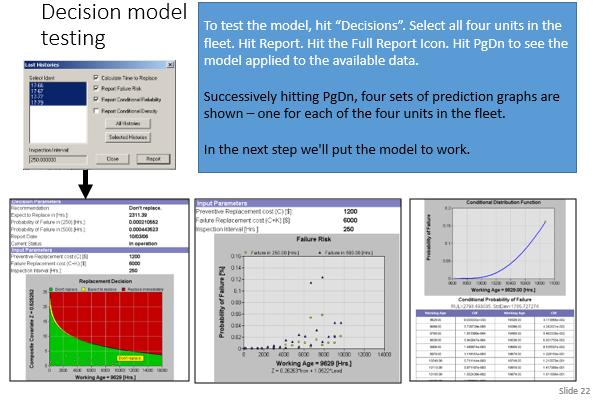
Executing these steps will report on the latest monitored values of each unit. Four sets of graphs are shown – one for each of the four units 17-66, 17-67, 17-77 and 17-79. By examining the graphs we see that none are in alarm at the current moment when this snapshot of the data has been made.
If the weighted sum of the significant variables (i.e. the y-axis plotted variable) falls in the Green region, no action is necessary; in the yellow, the item should be renewed before the next monitoring interval; in the read, the item should be repaired or replaced immediately. It should be noted that these boundaries vary with working age. This reflects the analysis findings that working age, as well as Iron and Lead, are significant failure risk factors. At some point in the past the values for 17-67 hit the red zone. This may indicate a spurious laboratory result that was corrected in a follow-up verification. (For modeling, known incorrect data should be removed from consideration.) Note that the x-axis scale differs from graph to graph depending on the current age of the unit.
## Post Tree Navigation
LRCM
- CMMS Impediments to Reliability Analysis
- Components of continuous improvement
- How to start LRCM
- Justifying Living RCM Certified
- Leading and lagging performance numbers
- Living RCM Certified – Consulting Services
- LRCM – Reporting failure modes of rotable components
- LRCM and HSE
- LRCM Justification Template
- LRCM reliability analyst survey results
- LRCM reliability technician survey results
- MESH – RCM knowledge continuous improvement
- Motivation, leadership, training
- PAS-55
- RCM – Dashboards
- Reliability engineer’s work cycle
- Service vs. maintenance
- Streamlined RCM and LRCM
- Structured free text
- The role of media in living RCM
- The winning paper at the XIV International Congress of Maintenance
- Two philosophies in maintenance improvement
- Waiting for CMMS maturity
- What is a pilot project?
- What is the difference between RCM and LRCM?
- Achieving Reliability from Data outline with video
- Course brochure – Living RCM Certified
- Deepwater Horizon
- Elevator description of LRCM
- How does LRCM “improve” RCM?
- Living RCM Certified
- Living RCM Certified eLearning
- Living RCM Certified® and ISO 14224
- LRCM – off the maintenance improvement radar
- LRCM-EXAKT – a general solution
- MESH Basic reliability analysis on the work order
- Mesh Living RCM Certified brochure – Mesh Cloud Service
- Obtener confiabilidad a partir de los datos – esquema del curso
- RCM – Analyst course outline
- RCM – feedback suggestion mechanism
- RCM – Living RCM
- RCM – LRCM dashboards
- RCM – feedback – suggesting a new failure mode
- Training course in achieving reliability from data
- Two kinds of decision making in maintenance
- Two LRCM purposes
- Videos
- Why Living RCM works
RCM
Reliability Analysis
- Achieving Reliability from Data
- Challenges to Achieving Reliability from Data
- Data analysis precedes reliability analysis
- Data is the key to the way forward
- Defeating CBM
- Does historical age data have value?
- Failure declaration standards
- Free text on the work order
- How much data is required for RA?
- How to assess EAM and CBM predictive capability
- Interpreting failure data
- LRCM – Reporting failure modes of rotable components
- Maintenance software
- Mesh: 12 steps to achieving reliability from data
- RA requires LRCM
- Reliability analysis in 2 dimensions-Part 2
- Sample selection
- So you’re getting an EAM
- Take the EAM data health check
- The CMMS barrier to RCM
- The data barrier to analysis
- The reliability data Catch 22
- Thoughts from a mine maintenance engineer
- Variations in a sample
- Warranty for haul trucks
- Weibull exercises
- What’s the right data?
- A survey of signal processing and decision technologies for CBM
- Achieving reliability from data
- CBM Defined
- Conditional failure probability, reliability, and failure rate
- Conditional probability of failure
- Conditional probability of failure vs. hazard rate
- Criticality analysis in RCM
- Diagnostics versus prognostics
- Difference between LRCM and EXAKT
- EXAKT’s Three Modules
- Expected failure time for an item whose maintenance policy is time-based
- Failure analysis for reliability analysis
- Failure probability prior to attaining MTTF
- FAQ
- FMEA according to Wikipedia
- Is “random failure” really random?
- Leading and lagging performance numbers
- LRCM and the Failure Finding Interval
- MTTF is the area under the reliability curve
- Myths about RCM in heavy mining equipment
- Non-rejuvenating events
- Optimal PM and spares strategies – exercises
- Performance metrics – Low and High level KPIs
- Problem statement
- Purpose of RA
- RA – Micro (day-to-day decision) analysis
- Random failure and the MTTF
- Random failure is exponential reliability decay
- RCM – Living RCM: Achieving reliability from data
- RCM vs RA
- Real meaning of the six RCM curves
- Reliability analysis is counting
- Reliability trend yes Weibull analysis no
- Remaining Useful Life Estimation Using Hybrid Monte-Carlo Simulation and Proportional Hazard Model
- Safety Instrumented Systems
- TBM or CBM?
- Terminology in LRCM
- Thinking RCM
- Time to failure
- What is PM?
- What is the scale parameter?
CBM
- A survey of signal processing and decision technologies for CBM
- Automating CBM
- Building a CBM decision model
- CBM Exercises
- CBM Optimization
- Combined analysis for early predictive maintenance
- Deploying the CBM model
- EXAKT cost sensitivity analysis
- EXAKT needs LRCM
- EXAKT vs Weibull
- Measuring and Improving CBM Effectiveness
- Optimizing a Condition Based Maintenance Program with Gearbox Tooth Failure
- RCM – Reliability analysis in more than two dimensions is CBM
- Smart CBM demo
- What is Maintenance Decision Automation?
- Confidence in predictive maintenance
- Diagnostics versus prognostics
- Inspections – CBM and others
- Inspections or CBM?
- Internal and external CBM variables
- NAVAIR and the PF interval
- Objectivity in condition based maintenance decisions
- Optimized interpretation of CBM data
- P-F Interval a red herring?
- PF interval from the failure rate
- PM, PdM, Proactive Maintenance
- Predictive analytics
- Temporary fix work orders
- The elusive P-F interval
- [1]The failure mode is the event that caused the failure. It is expressed in three grammatical segments: a noun, an action phrase, and a due-to clause. For example on an truck cab air conditioning unit: Hydraulic motor, shaft shears, misalignment.↩
[…] Building a CBM model […]