Slide 1 The objective (slides)
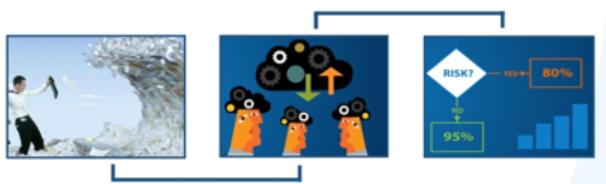
We should think of data as an ocean over which we navigate hoping to arrive at our destination. Most maintenance organizations having been overwhelmed by limitless data, lose sight of their journey’s end. The shore they seek is the ability to “achieve reliability from data”.
Slide 2 The milestones
Many maintenance organizations are exhausted after having expended substantial resources on conducting an RCM project. But as the time line shows, the 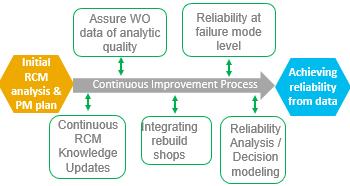 initial RCM analysis is only the beginning of the journey towards the goal of achieving reliability from data. The rectangles mark the challenges or milestones along the way. The first challenge requires the implementation of an EAM related procedure [1] by which to update the RCM analysis day-to-day as new experience, observations, and insights accrue. There are four other milestones: Assuring work order data quality, integrating data from rebuild shops, ability to monitor reliability at the granularity of the failure mode, performing reliability analysis and decision modeling.
Slide 3 The initial RCM dashboards
The initial RCM analysis is the starting point. Dashboards provide a means to assess the initial plan. For example maintenance schedules 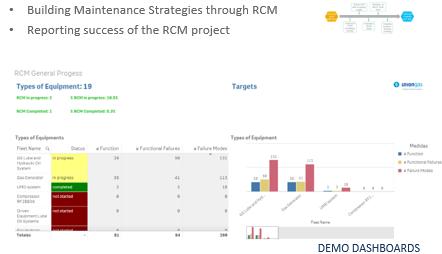 can be examined in detail. Dashboards gauge the relative effort of age/time based maintenance (TBM), condition based maintenance (CBM), their frequencies, and costs. Some dashboard widgits display the consequences of failure and the corresponding mitigation tasks. Other widgets report on the RCM status of equipment types and fleets, for example: in progress, number of failure modes, analysis complete and waiting for audit, audited, and implemented. RCM efficiency KPIs may be examined, for example, the number of failure modes per hour, the number of meetings and man hours, adherence to schedule, and so on. Widgets grouping tasks by frequency will determine the maintenance schedules to be uploaded into the EAM.
Slide 4 Milestone: Continuous knowledge improvement
The first milestone along the timeline of Slide 2 is “Continuous 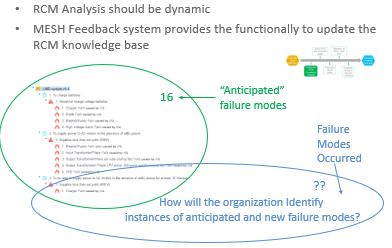 RCM knowledge updates”. Slide 4 is a Venne diagram of the disparity between theory and reality. The respective failure mode probability spaces overlap. The overlap represents the probability that anticipated failure modes actually occur. The non overlapping green elliptic area contains the identified failure modes that have not yet occurred, while the non overlapping blue area represents unanticipated failure modes that did occur. The slide asks the question “How will the organization incorporate the latter failure modes into the RCM knowledge base, in order that appropriate mitigation be applied?” The LRCM feedback method answers this question.
Slide 5 Milestone: Assuring work order data quality
Lacking analytical grade work order data in the EAM, most maintenance organizations cannot apply investigative reliability data methods to 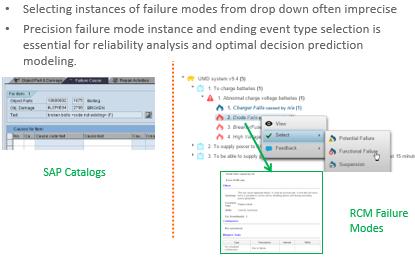 develop decision support models. The information chain has broken at the source, which is the work order data entry form. The technician selects failure mode choices from codified drop down lists abstracted from the RCM knowledge base. It is like looking at an RCM analysis through binoculars the wrong way without the RCM structure as guidance. Using the Living RCM (LRCM) method the technician can confidently select the appropriate failure mode in full view of its RCM context: its related function, failure, effects, consequences, and mitigating task(s). This data entry approach makes the possibility of error remote.
Slide 6 Milestone: Integrating the rebuild shops
When it comes to major inspections and rebuilds most maintenance organizations are at a loss on just how to include reported details into the 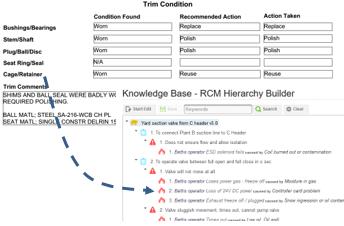 EAM data history. The Mesh LRCM work order interface solves that problem thereby providing valuable data points for subsequent reliability analysis. Mesh capitalizes on the one-to-one relationship between each item on the shop report and a node in the RCM tree. Each failure mode contains a tiny virtual clock. When an instance of the failure mode is reported in Mesh as either Failure, Potential failure, or Suspension its clock is “zero timed”. The clock resumes again when the component reenters service. The clocks of failure modes not reported, or reported as “reused” are not zeroed but continue logging time when placed back in service. By correlating failure mode life cycle duration and their life ending events with condition data, maintenance engineers may perform Reliability Analysis (RA) and develop decision supporting predictive algorithms for all significant failure modes.
Slide 7 Milestone: Reliability analysis at the failure mode level
Having successfully set up our work order procedures using the LRCM methodology, the major obstacle to RA and decision modeling will have been 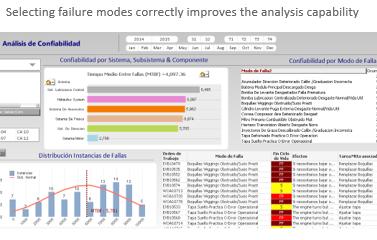 removed. Now we can examine reliability at the failure mode level in depth. The failure mode is often referred to as “the currency of maintenance” given that its failure behavior and consequence mitigating task determine the effectiveness of maintenance and, ultimately, the profitability of the enterprise. Once we are confident in EAM work order database data quality, we will have unrestricted capability to analyze, develop and improve our maintenance strategy.
Slide 8 Milestone: Reliability Analysis / Decision Modeling
We arrive at the last milestone towards our goal of “Achieving reliability from data”. Accurate, precise, consistent age data in our EAM clears the 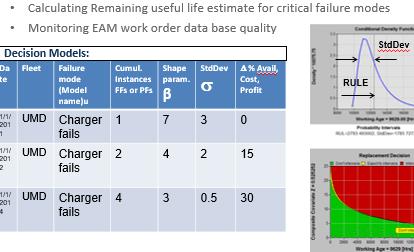 path to many reliability analysis and decision support technologies. Predictive maintenance researchers in academic and military institutions have brought powerful decision algorithms to the world. Until now, however, these tools have remained unassailable by our maintenance engineering staff due to the lack of (high quality analytic) data. By ensuring perfect transcription of work order data to the EAM LRCM has finally removed the long standing barrier to decision modeling. The table displays KPIs that measure leading and lagging performance indicators. For example the “shape parameter” β (beta)[2] indicates the relative influence, on failure probability, of age versus condition data. This KPI is most affected by the quality of EAM work order data. Low β values indicate good work order information procedures. High values mean poorly recorded work order observational data, and would indicate remedial managerial intervention. The Standard Deviation is a measure of predictive performance. The last column is a high level (i.e. lagging) KPI that monitors enterprise profitability in relation to the failure mode in question.[3]
Slide 9 So how to do it?
What have we really done? In a word or two we have built a bridge between theory and practice. Theory is contained in the RCM knowledge 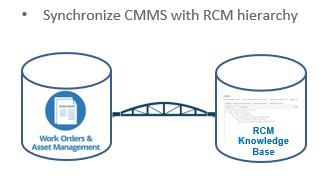 base comprising what we know about an asset’s failure behavior. In an ongoing process, new insights, recollections, and predictive analytic models will have been added to the growing knowledge body. On the bridge’s other extremity the EAM work order database contains the practice, the reality of precisely what the physical assets did and what we maintainers did in anticipation of or in response to failure. The bridge enables analytic correlation resulting in improved practice. In most organizations the bridge is broken or absent entirely. Without the bridge “Achieving reliability from data” will never happen.
- [1]In Mesh this procedure is called knowledge “feedback”.↩
- [2]The shape parameter β is an “age” influence indicator in the extended Weibull model:
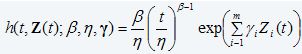
age t being a “mixture” of all condition data not specifically included as a measurement value Zi(t) in the vector of condition monitored data Z(t). In other words β is the “catch all” for all significant CBM variables that have been left out of the decision model. That is to say, the more selective the predictive model is of significant influential condition data the lower will be the value of β and the better the predictive performance. β is most influenced by the quality of EAM “age” data. More information on this can be found in the article Confidence in CBM decision making↩
- [3]The lagging performance indicator monitors a failure mode’s improved total cost normalized to a unit of time or of production. Since cost savings related to maintenance translate to enterprise profitability this KPI offers the ability to link economic performance with specific maintenance policies. The theory and calculations behind these KPIs can be found in the technical paper The Elusive PF Interval.↩
- Measuring and Improving CBM Effectiveness (100%)
- Performance metrics – Low and High level KPIs (53.3%)
- Leading and lagging performance numbers (53.3%)
- Structured free text (53.3%)
- EXAKT cost sensitivity analysis (53.3%)
- The elusive P-F interval (RANDOM – 46.7%)