 01-01 While failure modes and effects analysis may have some small intrinsic interest of its own,
01-02 the reason for our concern with failure is its consequences.This was a statemen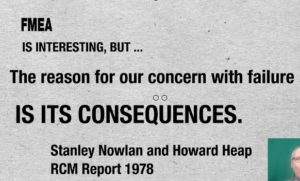 t from Nowlan and Heap’s RCM report in 1978. The idea that failure prevention was not necessarily the prime goal shook the foundations of maintenance management theory.
 The consequences of the failure rather than the failure itself drive the maintenance plan. That obvious seems to us now once having been articulated.
01-03 Nevertheless, up until the early 90s, massive yearly equipment overhauls were carried out religiously in many industries, without a formal analysis the failures’ consequences.
01-04Throughout the 70s and 80s most authors and consultants still extolled the  benefits of Age Based Preventive Maintenance, seemingly, for its own sake.
John Moubray In his book RCM II in 1991 emphasized that shifting the focus of maintenance management onto the Consequences of failure was, in his words, “one of the most extraordinary revelations of RCM”.
Why does the failure matter.
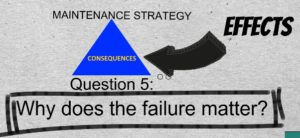 02-01 The RCM maintenance strategy pivots on the consequences. Question 5 “Why does it matter?” determines the consequences of the failure mode under examination. How do the analysts decide upon the consequences? They consider the Effects of Question 4. The Effects will have been comprehensive enough for the analysts to state, unequivocally,why the failure matters.
 02-02Furthermore, the Effects narrative will often direct the analysts towards an appropriate consequence mitigating policy. For example, the effects may describe the formation of visible cracks in a support structure. The analysts might include their considered experience that such cracks are benign until they reach a certain length. The narrative might prompt the choice of a periodic visual or ultraviolet die penetrant, or other type of appropriate condition based maintenance inspection task.
Once the consequences have been determined, the RCM decision tree constrains the analysts in deciding what they will do about it.
Quiz 1
2.4.1 With regard to understanding the difference between “Failure Effects” and “Failure Consequences” which of the following descriptions are most helpful?
- A failure mode is the effect by which a failure is observed on the failed item.
- The failure impact on equipment function is the effect on equipment-unit function, for example: critical, degraded, or incipient failure.
- The Effects describe what happens when the failure mode occurs.The Consequences describe why the failure matters.
- The Consequences describe the effect of PM on failure rate.
- All of the above.
Four consequences
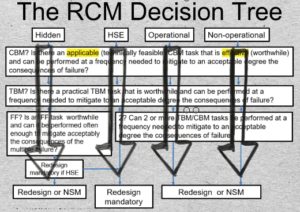 03-01 What to do about a failure’s consequences is governed by the RCM Decision Tree. It is a flow diagram with four alternative vertical paths. The process for analyzing a maintenance policy decision will begin at one of the four boxes in the top row. Which box will have been determined by the RCM consequences step 5 of the 7 question RCM procedure.
The top left-most box of the RCM decision tree represents “Hidden failure” consequences. The failure of a safety device or backup function is, usually, “hidden”.
The three boxes on the right represent respectively Health-Safety-Environmental, Operational, and Non-Operational consequences of failure.
Quiz 2
2.4.2 RCM identifies four types of consequences (Hidden, Health-Safety-Environmental, Operational, Non-operational). True or False.
Decision logic
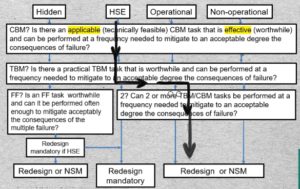 04-01 The RCM decision tree guides the analysts along a trajectory that ultimately answers Question 6: “Is there a repetitive maintenance task or set of tasks will reduce the failure’s probability and severity to an acceptable level. And, if not, Question 7: Is there a default one-time action that will adequately reduce or eliminate the consequences.
Maintenance tasks
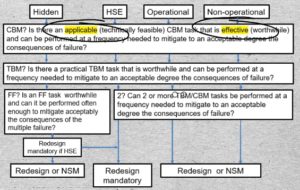 05-01 Each node on the RCM decision tree, actually asks two questions:
“Is the candidate consequence mitigating task
- Applicable, and is it
- Effective?
to test whether a proposed maintenance policy, that is a type of task, should be selected.
The policy being considered may be a Condition Based Maintenance or CBM task. Or an age or calendar time based task called TBM. Or it may combine two or more individually scheduled tasks that, together, will meet the applicability and effectiveness criteria. Finally the appropriate maintenance policy may be a Failure Finding task, applied to a hidden failure.
Technically feasible and worthwhile
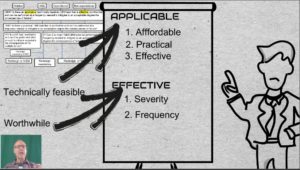 06 By “applicable” N & H meant that the task can be performed at an affordable cost and at a practical frequency, yet still be effective. By “effective” they meant that the task would accomplish its objective – to reduce the severity and frequency of the consequences to an acceptable level.
John Moubray suggested the expression “technically feasible and worthwhile” for N & H’s “applicable and effective”, believing that these terms offer additional clarity.
Quiz 3
2.4.3 A PM task that can be done frequently enough to sufficiently reduce risk is (choose one of): 1. Applicable 2. Effective 3. Applicable and effective 4. Worthwhile 5. Technically feasible.
Costs and benefits of PM
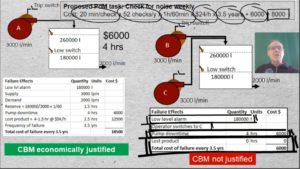 07-01 So that we can appreciate the economics of prevention Moubray considered two idealized operating contexts. Pump A has one dominant failure mode, “Bearing seizes”. It is assumed that there is no secondary damage and no health, safety, or environmental consequences. Whether the bearing is replaced preventively or as the result of failure would not affect the $6000 cost of labor and material. It takes 4-hours from the time of failure to bring the pump back into service.
Let’s examine the effects of Pump A’s bearing failure: The low level alarm will sound. Maintenance will be called and will replace the bearing and bring the pump back into service in 4 hours. But the tank will run dry after 1 1/2 hours. Production, therefore, will halt for a period of 2 1/2 hours The cost of lost production is $12500 so that total monetary consequences of failure will be $18500. According to EAM records, this failure mode occurs, on the average once every 3 1/2 years.
Someone on the RCM team might propose the Predictive Maintenance task: “Check bearing for noise weekly”
![]() 07 The cost of this policy will be: 20 min/check x 52 checks/y x conversion factor from minutes to hours x the hourly wage over 3 1/2 years + the $6000 renewal cost which gives us a total of $8000. $8000 is significantly less than $18500. Therefore the CBM task meets the criteria of being both technically feasible and worthwhile.
07 The cost of this policy will be: 20 min/check x 52 checks/y x conversion factor from minutes to hours x the hourly wage over 3 1/2 years + the $6000 renewal cost which gives us a total of $8000. $8000 is significantly less than $18500. Therefore the CBM task meets the criteria of being both technically feasible and worthwhile.
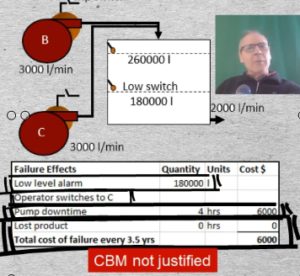 What about the case of identical Pump B backed up by identical Pump C? The effects of bearing failure on Pump B are: The low level alarm will sound. The operator will switch over to Pump C. The pump downtime will again be 4 hours. And the repair will cost $6000. But there will be no production loss. Since 8000 is less than the $18500 CBM cost, CBM, although it is technically feasible, does not meet the criterion of being worthwhile or effective. No scheduled maintenance is recommended for pump B, even though it is identical to Pump A. The operating context has determined the maintenance policy for Pump B.
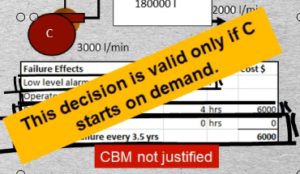 The argument for NSM, in the case of Pump B is only valid provided we can be confident that C, a hidden function, will actually start when called upon.
Principle of comparison
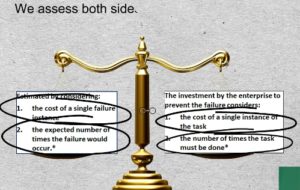 08-01 The preceding calculation, admittedly, is time consuming. It is seldom performed explicitly during the RCM analysis session. More often, the PM or PdM policy decision is arrived at through judgment and consensus. Nevertheless the principle of comparison lies behind the decision. We compare the cost of a failure multiplied by the average number of times the failure is expected to occur, to the cost of a CBM inspection multiplied by the number of times we would need to perform that task, We assess both sides of the comparison over a sufficiently large period of time. In the example we used 3 1/2 years, which was the bearing’s mean time to failure. This calculation may eventually be performed within the ongoing living RCM process. The update might be initiated by a technician, having observed the potential failure.
Quiz 4
2.4.4 If a PM task is considered to be applicable and effective in accomplishing its stated risk objective it should be included in the maintenance plan True or False.
Hidden failures
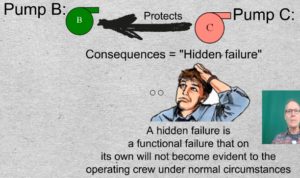 09-10-01 Let us return to the failure of Pump C. It is a backup function protecting Pump B. The consequences of the failure of Pump C are said to be “hidden failure” because, under normal circumstances, operating personnel would be unaware that the failure has occurred.
If C fails, there are no immediate consequences, other than the fact that no one knows it has failed. C’s failure matters only if B subsequently fails. Hence the definition of a hidden failure is: A functional failure that on its own will not be evident under normal circumstances.
Multiple failure
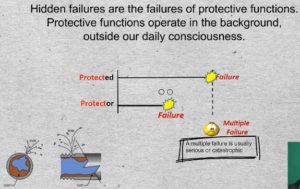 11-01 Hidden failures are the failures of protective functions. Protective functions operate in the background, outside our daily consciousness.
Consider the timeline of a protected function, such as Pump B, that eventually may end in functional failure.
For protection to be effective the Protector must be available at the moment that the protected function fails. If the protector is unavailable at the moment of failure of the protected function, the resulting event is called a “Mulitple Failure”. A multiple failure is usually serious, or even catastrophic. A toxic chemical leak from pipe buried deep in the ground is not “hidden”, by RCM definition. Eventually that failure, even 50 years from now, just to emphasize the point, will, on its own, make itself known. Nothing else need fail. By this definition, all hidden failures are protection or backup functions.
Quiz 5
2.4.5 A multiple failure can occur without anyone knowing about it. True or false?
Availability as performance
12 How do we set a performance standard for a protector? Consider a Smoke detector. What do we want it to do? Detect smoke. We want pump C to pump liquid.
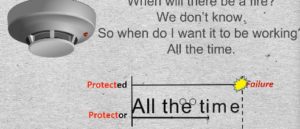 However, we have another performance expectation. We want it to work when we need it. This is a second dimension of our expectation. When will I need the smoke detector? When there’s a fire. When will there be a fire? We don’t know. So when do I want it to be working? All the time. Is that a realistic expectation? No. What you have just said is that your desired performance exceeds the asset’s capability.
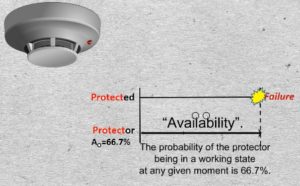 The safety function’s “Performance” is its “Availability”. For example we could specify that our desired availability is 66.7%. In other words our protection should be availble 2/3 of the time. Another way of saying it is that the probability of the protector being in a working state at any given moment is 66.7%.
Should the the protected function fail at a moment when the protector is non-functional we will experience a multiple failure.
Reliability as performance
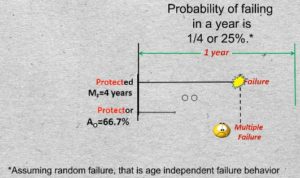 13-01 A measure of performance of the protected function is its reliability. We may express an item’s reliabiltiy by its Mean Time to Failure or it MTTF also known as its Average Life.
Say the reliability of the protected function, for example Pump B, defined by its MTTF, is 4 years. We’ll abbreviate that by the symbol MsubF. That is the same as saying that its probability of failing in any given year is 1/4. (We are assuming random failure, that is age independent failure behavior, which is generally true of complex systems).
Two independent events
14-01 Let’s define two events. Let Event A be the failure of the Protected Function. Its probability of failure in a year is 25%. We can also say its unreliability = 25%.
Define Event B as the protector being down at an inopportune moment. The probability of Event B is the Protector’s unavailability = 1/3. And the inopportune moment is a moment when its service is required.
The probability of two independent events occurring, which we called a multiple failure. is the multiplication product of their individual probabilities.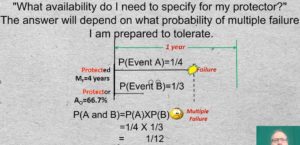
We’re still trying to answer the question, “What availability do I need to specify for my protector?” The answer will depend on what probability of multiple failure I am prepared to tolerate. Is 1/12 small enough?
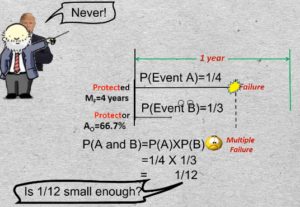 If you asked the owner of a hotel chain what probability of his fire alarm system failing at the moment of a fire, he is prepared to tolerate, he would undoubtedly say 0. Most senior executives start out by saying zero, never. But the reliability analyst says you cannot have never.
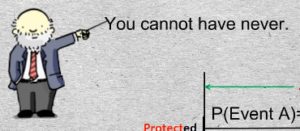 That would be saying that: you’ll never have a fire or that the fire protection system will never fail. If I can’t have never, then what do I want? Availability of the protective function is in fact a manageable variable. If it is manageable, it must be managed.
So the reliability analyst says “You tell me what (multiple failure probability) you want to tolerate, and I’ll propose a system that will give it to you.”
Quiz 6
2.4.6 MTBF is a convenient approximation of reliability. A safety system’s performance is measured by its availability. Which of the following is most accurate?
- A safety function’s reliability determines the probability of a multiple failure.
- A protected function’s availability determines the probability of a multiple failure.
- The unavailability of the safety device multiplied by the unreliability of the protected function yields the multiple failure probability.
Who should decide and how?
 15-01 Who should decide what the multiple failure probability should be?
15-02 If we turn our attention to the workplace,
15-03 it is reasonable that the decision should be, in large measure, taken by the people who 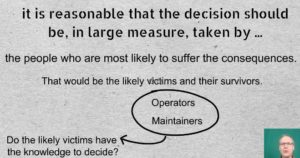 are most likely to suffer the consequences. That would be the likely victims and their survivors. In many industrial situations the victims will include the operator and the maintainer. Do the likely victims have the knowledge to decide?
15-04 Experience has shown that employees are realistic. What factors will most strongly bear upon the decisions they are going to make.
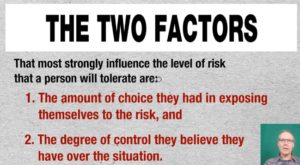 15-05 The 2 factors that most strongly influence the level of risk that a person will tolerate are:
- the amount of choice they had in exposing themselves to the risk, and
- the degree of control they believe they have over the situation.
Quantifying the probability of fatality in familiar situations
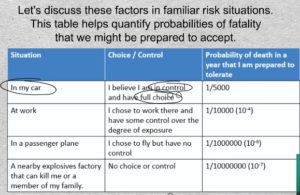 16-01 Let’s discuss these factors in familiar risk situations. This table helps quantify probabilities of fatality that we might be prepared to accept. In the case of driving one’s car, here are the choice and control factors. I am in control and I chose to be on the road. I might accept a probability being killed in any year of, say, 1 one in 5000.
Consider the probability of being killed in the workplace. You chose to work there and you have some control over the degree of your day-to-day exposure. Since you believe you have less control than when operating your own automobile, you will be less tolerant, and might accept a 1 in 10000 probability of being killed on the job in a year.
Say you choose to travel by commercial airplane. Of course, you have no control as a passenger over the hazards of flying. You might demand a proven safety record of the airline industry of 1 in a million of being killed in any given year.
Finally, a chemical plant moved into the vicinity of your home. An explosion could kill you or a member of your family. This situation is one of no control and no choice about exposure by people who are off site. (Think of Bhopal or Chernobyl,). What do we tolerate? 1 in 10 million? This is your call because it is your life.
This table is an example of what Moubray called a risk continuum that depends on people’s consideration of the factors of choice and control.
Probabilities of fatality on the road and at work
 17-01 Here is some statistical data to give us a reference point with which to judge probabilities of being killed on the road that we are prepared to tolerate.
Do you tolerate that? If you didn’t, you would not drive on the road. In the last election, did any politician make an issue of road safety? No. The populations of the respective countries have accepted these risks.
One dominant cause of fatality is DWI or driving while impaired? Society has decided that that one particular cause is intolerable. This suggests, therefore, that most people tolerate, about, 1/10000. I am controlling to a great extent my use of the road. I have the choice and I fully exercise that choice.
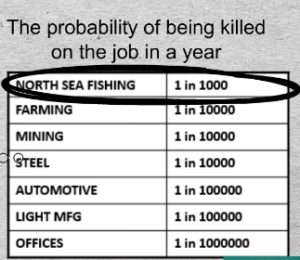 With regard to being killed on the job, employees have the choice and some control. Every worker is responsible to a considerable extent for his own safety and he exercises a degree of control. And he has a choice. “I don’t have to work there.” What do workers tolerate? The world’s most dangerous job is that of North Sea fishermen. They accept a 1/1000 chance of being killed in any one year.
Industry perspective
3 integrated steel mills in on 3 continents had 4 deaths in 4 years. With a total work force of 7000 that translates to a 1/7000 chance of being killed on the job in a year. These figures are astonishingly similar throughout such industries.
Companies are very serious about safety. Take 3 reputable companies in 3 advanced economies. They achieve a 1/10000 fatality probability in a year. Do the employees tolerate it? A few do express their intolerance with their feet.
In the Automotive industry, for example Chrysler, in Syracuse, upstate New York. No one was killed on the job in 30 years. There are 3000 employees. The probability of being killed there in one year, we may conclude, is less than of 1/100000.
Worker perspective
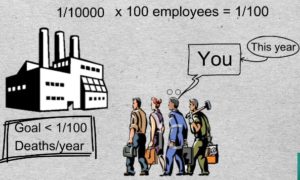 18-01 From the perspective of an entire plant, a typical corporate goal could be, to experience one or fewer fatalities per 100 years. How does that translate to the viewpoint of a worker?
- Say that you work in an industrial North American plant with 100 fellow workers.
- You are aware of the industry statistics I cited earlier, that the probability of a fatality in that industry is, say, 1 in 10000 in a year.
- Therefore you accept that you or one of your co-workers could be killed in a given year with a probability of 1/10,000 x 100 employees = 1/100. Which is equivalent to the corporate objective of one fatality in 100 years. And it could be you and it could be this year.
Plant perspective
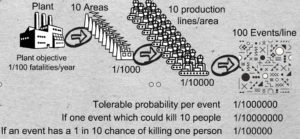 19-01 Let’s allocate portions of that corporate objective probability throughout the plant. Say there are 10 areas on the site. On the average each area will need to respect a yearly fatality probability of 1/1000 in order to achieve 1/100 overall for the site.
Now, assume 10 production lines in each area. By the same token, each line will need to have a yearly fatality probability of 1/10000.
Finally, say that we identified 100 events in a line that could kill 1 person. then the 1/100 plant wide fatality probability translates to 1/1,000,000 tolerable probability associated with an event, say a failure mode or multiple failure.
In probabilistic risk assessment, what do we call an event? Does every event neatly kill one person? If one event which could kill 10 people the tolerable probability of that event must be reduced to 1 in 10,000,000.
On the other hand, let’s assume a crane cable breaks. Then we would factor in the probability that someone is standing there at the time, say 1/10. If an event has a 1 in 10 chance of killing one person its tolerated probability would increase to 1 in 100,000 If you want to be rigorous and systematic, this is how you can go about getting the answer to the question of tolerable probability. Although this may be a simplistic approximation of reality it provides the logical approach for justifying the cost of additional safety measures.
Purely monetary risk
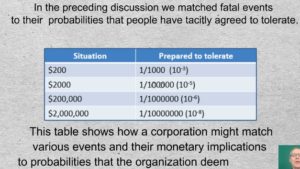 20-01 In the preceding discussion we matched fatal events to their probabilities that people have tacitly agreed to tolerate.
This table shows how a corporation might match various events and their monetary implications to probabilities that the organization deems tolerable.
Quiz 7
2.4.7 Risk is often assessed as the multiplication product of failure (or multiple failure) probability and the human value of the losses associated with failure. In the RCM way of thinking whose viewpoint should be key in deciding what level of prevention or mitigation is appropriate?
- A government agency should have the final say as to what maintenance or design strategy is required.
- The employee’s union should have the final say.
- The likely victims and their survivors, as well as those who will need to deal with the ramifications of the failure should have the decisive voice.
Reducing the probability of multiple failure
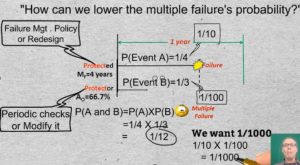 21-22 We began the discussion by asking whether a MF probability of 1 in 12 would be tolerated. We then saw typical world examples that require considerably smaller probabilities. The question, therefore, is “How can we lower the multiple failure’s probability?” One way would be by reducing the probability of failure of the protected function. We might do this by applying a suitable failure management policy or by redesign of the asset or its operating procedures.
- Additionally, we could increase the availability of the protector. And there are two ways to do that:
- We can check periodically whether the protective device is still working and repair it if it has failed, or
- We can modify the protective system in some way.
Say that once in 12 years there is a blast furnace melt down that kills someone because a protective device failed. Let’s say we want a 1/1000 multiple failure probability of the furnace and its protective system. What do we have to do to this system to get from 1 in 12 to 1 in 1000? We might increase the protected function’s reliability from 1/4 to 1/10. And we can reduce the nonavailability of the protective system to 1/100. That implies that we can tolerate 1% dt or, stated another way, 99% avail of the protection.
Now, the product of the two events, failure of the protected function multiplied by the non-availability of the protector yields the desired 1 in 1000 MF probability.
Proliferating hidden functions
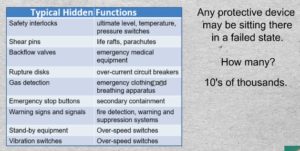 22-01 Any protective device may be sitting there in a failed state. We won’t give it a thought until … we need it. How many are out there? In complex plants tens of thousands. So this is not a minor subject for our consideration, especially considering that a large percentage of past industrial disasters involved multiple failures. Typically 1/3 of protective devices receive no attention.
HSE Consequences
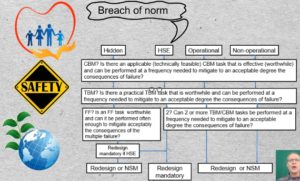 23-01 Health, safety, and environmental consequences are well appreciated today in developed economies where workers have collectively drawn the line at safety of life and limb. Governments have imposed penalties on polluters.
In RCM it is the breach of an environmental standard rather than the actual act of pollution that is cited as Environmental consequences. Regulatory bodies have taken on the responsibility of setting the standards, so that organizations have clear emissions targets.
Operational and non-operational consequences
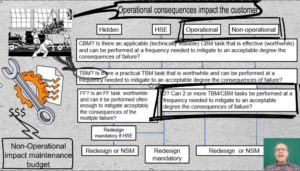 24-01 Operational and non-operational are the final two consequences in the list. Operational consequences impact the customer, for example, late delivery, quality, and cost. Non-operational consequences impact only the maintenance budget.
Note the node, “Two or more of the above”. As an example consider the disks of a gas turbine and the roots of turbine blades. They are replaced at 1/3 of their design life as a safety measure. But that alone still doesn’t bring the risk down to a tolerable level. The scheduled discard task reduces the failure probability – but not enough. The probability of a premature failure is not close enough to zero. Therefore In addition to scheduled discard, maintenance plan also includes on-condition (predictive) maintenance, for example chip detection or borescopic inspection. The combination of tasks reduces risk to the degree required.
If no proactive tasks can be found to reduce the probability and severity of the consequences to a tolerable level, we drop down to the default alternatives in the lowest nodes in the decision hierarchy. Either NSM or Redesign. Redesign is mandatory if we are on the HSE track and optional on the Operational and Non-operational tracks.
Quiz 8
2.4.8 When is the decision tree node “Two or more tasks” appropriate for selection by the RCM analysts?
- When two applicable and effective tasks are easy and inexpensive to perform.
- When a single PM or CBM task will not sufficiently reduce risk but the combination will.
- When health, safety, or environmental consequences result from the failure.
Criticality analysis 2 Phases
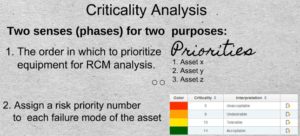 2501 The term “Criticality analysis” is used in two different senses for two different purposes. One is to decide the order in which to prioritize equipment for RCM analysis. The other, is to attach a risk priority number also called a criticality number to each failure mode within the asset.
Prioritizing equipment for analysis
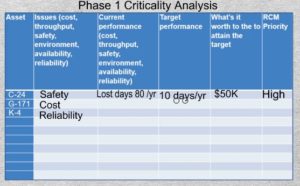 26-01 There are a number of formal methods of performing Phase 1 criticality analysis. However, this informal method usually suffices and can be carried out quickly in a meeting with the operational and maintenance managers. As leaders of the areas they begin by listing their major assets in column 1. Then in column 2, regarding each asset, they they will state the issue of greatest concern. It could be cost, throughput, quality, safety, availability, reliability, or environmental excursions. Next in column 3 they will estimate the department’s current performance for the asset with regard to the issue of concern. In column 4 they will propose a target that they reasonably aim to attain. In column 5 they answer the key question, “What’s it worth to organization to achieve the stated target”. Having completed all the preceding columns the last column containing the priority for conducting RCM on each major asset will be easily set.
Phase 2 Criticality analysis
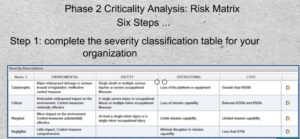 27-01 The phase two criticality analysis can be perfomed using a risk matrix. Here are six steps for setting up and using a criticality grid or matrix. In Step 1 complete the severity classification table for your organization or industry. In each cell describe an event or situation characterizing a level of severity under each of the columns, Environmental, Safety, Operational, and Cost.
27St2 28-01expl Step 2 sets the frequency or probability of occurrence in units of time relevant to the industry. For example production throughput. Calendar time is also often used for this purpose.
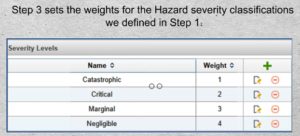 28-01 29-01ex Step 3 sets the weights for the Hazard severity classifications we defined in Step 1.
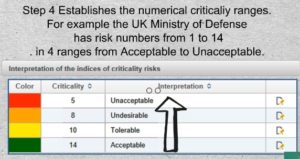 29-01 30-01ex Step 4 Establishes the numerical criticaliy ranges to be used. For example the UK Ministry of Defense has risk numbers from 1 to 14. in 4 ranges from Acceptable to Unacceptable.
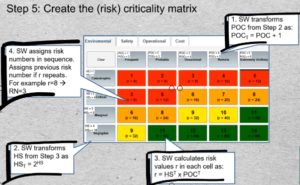 30-01 30-02ex Once the data of steps 1 to 4 have been entered the application software will create the risk matrix for each category that we identified in Step 1. The method requires that the Hazard Severity and Probability of Occurrence of steps 1 and 2 be transformed by the software according to the formulas shown. Next the products of multiplication of those transformed values in the column and row headers are displayed as risk values “r” in each cell. Finally risk priority numbers are assigned sequentially starting at the top left cell.
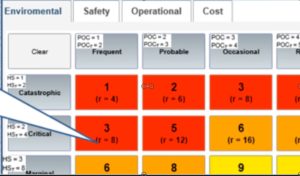 When a cell contains a risk value that has already been assigned a risk priority number the software will repeat that risk priority number in that cell. For example in starting the second row, the risk 8 already occurred in the third cell of the first row. And so on, until the entire grid is populated. The colors appear according criticality ranges to which they were assigned in Step 4.
Step 6: Perform Criticality Analysis
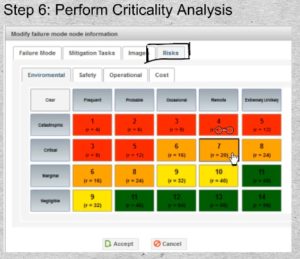 31-01 Now that the risk matrix has been established, it will apply throughout the organization. The matrix will appear as a tab in the RCM failure mode dialog. The RCM analysts, or more frequently the facilitator on his own will consult the Effects and Consequences and, for each failure mode, select the appropriate cell in each applicable risk category.
Conclusion
 32-01 This concludes the RCM failure consequences module. You may now proceed to the next module entitled “Failure Management Policies”
© 2017 – 2021, Murray Wiseman. All rights reserved.

