Optimal maintenance strategies
The exercises in this section follow from and extend the analyses conducted earlier in the Weibull exercises section.
Age preventive replacement policy
Discussion
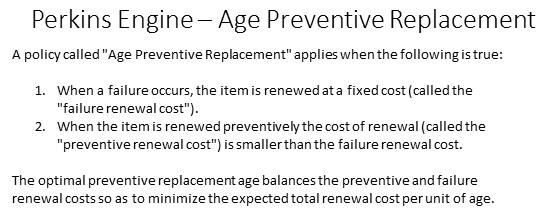
Most physical assets lend themselves to preventive maintenance based on usage. The greater the age the more stresses will have accumulated thereby diminishing an item’s failure resistance. Obviously the one time cost of intervening preventively must be lower than the combined failure cost and related production losses. If this is the case, the question arises of how often PM (total engine preventive renewal) should be performed so as to attain an overall long term objective, usually the bottom line profitability of the enterprise.
Business data and requirements
Once an age data analysis such as Weibull analysis is carried out we may introduce business factors and constraints to optimize preventive renewal policies and spares storage policies. Slide 3 lists the policy planning information derived from the optimization exercise.
Verify and complete the general data
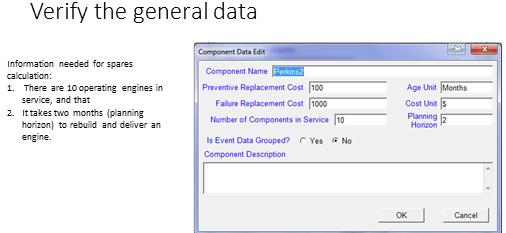
Although the original exercise used data from a single engine location operating for 10 years, we are now told that the age reliability relationship will apply to 10 such engines in service at 10 different locations (ships).
The turn around time for an engine rebuild once it arrives at the rebuild shop is two months. The cost penalty for failure in service is fixed at 1000:100.
Age preventive replacement policy
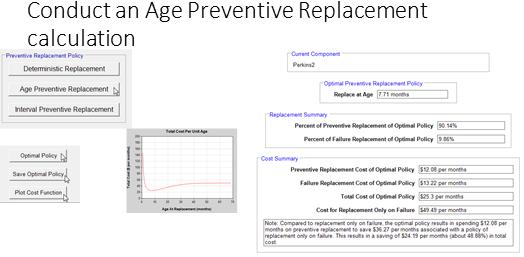
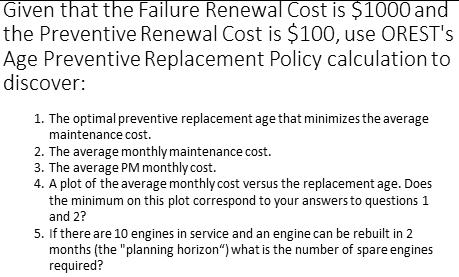
We bring back the previously saved Weibull analysis. Then we conduct the age preventive replacement calculation by clicking on Optimal Policy, saving, and plotting the cost function. The low point on the cost versus replacement age graph designates the recommended (optimal) PM policy.
The report summarizes the percentages of preventive and reactive effort that will result by adhering to the optimal policy. Similarly the costs of PM and reactive maintenance are predicted to be $12 and $13 respectively. The cost versus replacement age graph approaches $49 asymptotically for for an infinite PM interval. That is to say, no PM.
Spares requirement
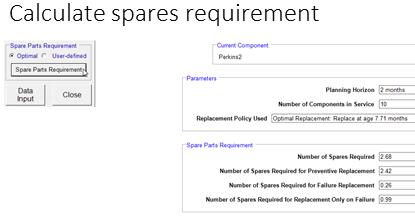
Given that a finite turn around time (planning horizon) must be accounted for in planning and that 10 engines are in service any one or more of which may fail at any time, the spare engine inventory calculation is performed. The results indicate that 3 spare engines must be purchased for maximum cost effectiveness. Thus “3” is the optimal spares inventory strategy.
Interval preventive replacement policy
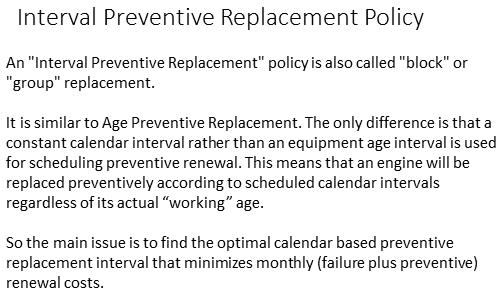
When business conditions require a calendar based schedule for maintaining a group of items the Interval or block or group replacement policy must be adopted. Intuitively we would conclude that this policy would be more costly because it is less flexible. The analysis will lend evidence to the policy decision’s long term economic implications.
Perkins engine with interval rather than age replacement
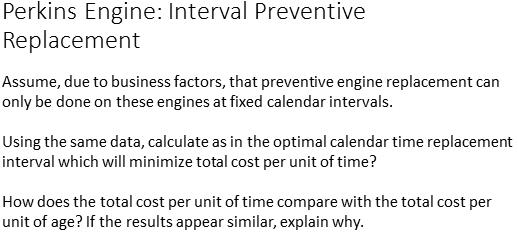
The example will show that, even in simple situations, the results of an optimal policy calculation are not necessarily obvious or intuitive. Given the voluminous data capability of our EAM and related systems, it is incumbent upon the maintenance and reliability engineer to organize systems and procedures to provide the needed data for analysis.
Interval preventive replacement calculation for Perkins engine fleet
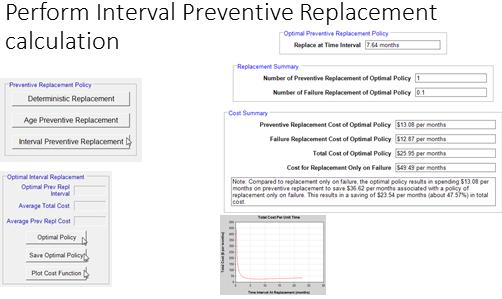
Surprisingly, the results are similar to those of the age replacement calculation. Why? Because the engines are operated continuously or consistently on a given calendar interval. That is the hours of operation do not vary significantly from one month to another. Hence it is not surprising that the interval replacement policy calculation results are similar to those of the age based replacement policy.
Perkins interval replacement policy spares calculation
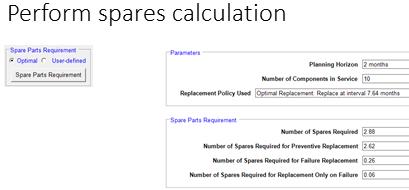
Once again the optimal spare engine inventory is 3 for the same reason as described in Slide 9.
Bear in mind that the spares policy accounts for both randomly failed engines as well as the calendar interval replacements and overhauls.
Deterministic replacement policy
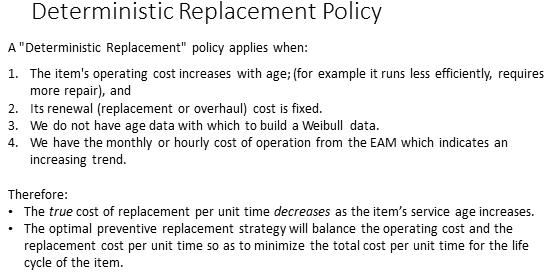
When organizations do not follow good maintenance information procedures such as those described in the living RCM module of this course, they will be unable to perform age based or condition based reliability analysis for establishing optimal maintenance policies. As an alternative they may default to purely financial when it is known that total costs of operation increase with the asset’s age.
Data input for a deterministic policy
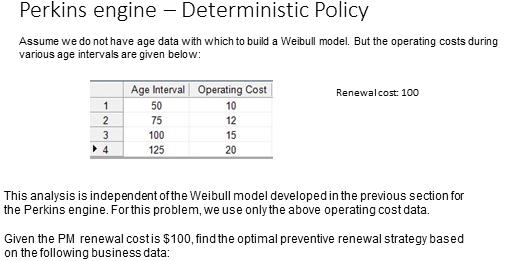
The EAM is an excellent source of financial information. Accounts will have been set up for tracking operating costs. Therefore data such as that in slide 12 can easily be extracted for a deterministic analysis. The problem statement is exactly the same as that for a probabilistic analysis. Namely, what is the optimal renewal strategy for the asset?
Deterministic policy calculation and results
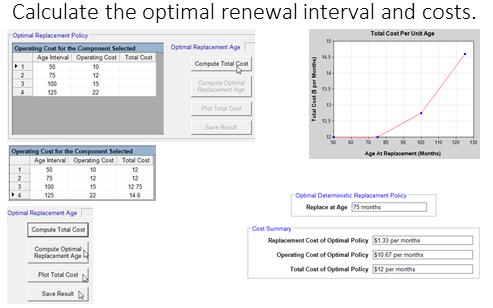
The costs used in this calculation include maintenance labor and materials accrued to the asset’s Repair and Maintenance account. The model does not include consequential costs as a result of failure. The cost penalty for failure relative to prevention used in the probabilistic model should also be based on information extracted from the EAM.