When most people discuss or practice RCM, they are really referring to initial RCM, the process by which the Functions, Failures, Failure Modes, Effects,
Consequences, and mitigating actions are analyzed and documented based on the knowledge available to the analysts at the moment of analysis. The analysts’ recollections of the asset’s failure behavior are imperfect. It is necessary, therefore, to extend initial RCM to the operational phase so that the maintenance plan will be continuously improved as new information becomes available day-to-day from work order related experience. The Living RCM process ensures perfect data for analysis and decision modeling.
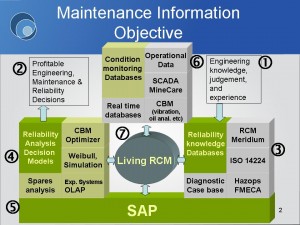
The components of a maintenance decision system
1: The people in a maintenance organization possess skills, knowledge, and experience in operating and maintaining the organization’s physical assets. Management provides systems and software designed to capture the benefits of the organization’s “human capital”.
2: Management systems and processes are intended to transform this available knowledge into profitable day to day decisions that reflect an item’s failure behavior. Those decisions determine when, where, and how to perform maintenance to best effect.
3: Reliability knowledge bases, such as RCM and other systems, capture the knowledge elicited from experienced personnel and organize it for optimal scheduled maintenance or exposing a redesign requirement .
4: Engineers apply Reliability Analysis (RA) techniques with which to build “decision models”. These models assist them in making the best possible maintenance decisions on what to maintain, when, and how. RA software applications are powerful, yet underused because the data needed by the organization’s Reliability Engineers is missing or inadequate. LRCM addresses this flaw in today’s maintenance information systems.
5: The Work order system, for example SAP, should enable continuous improvement in the reliability knowledge base. Additionally it should provide the data necessary for RA. Currently, it fails in both these areas. LRCM addresses these gaps.
6: A third set of maintenance decision tools should work in harmony with the other systems. These condition monitoring tools record observational data collected by a variety of automated and manual monitoring techniques. The components include real time databases, sensors, vibration analysis, oil analysis, and other systems designed to provide the reliability analyst with data to aid in maintenance decision making. The resulting monitoring databases are enormous but seldom exploited by automated decision models.
7: There is a glaring lack of inter-operability among all these components. LRCM harmonizes these systems for optimal, verifiable, day to day decisions.
LRCM Functions
Practical decisions in maintenance must be:
- Automated,
- Optimal, and
- Verifiable as having contributed positively to maintenance objectives.
The most basic LRCM function ensures “analyzable” data in the SAP work order database. A lack of “good” data is the single most important obstacle to Reliability Analysis (RA). This obstacle frustrates the modern Maintenance Engineer.
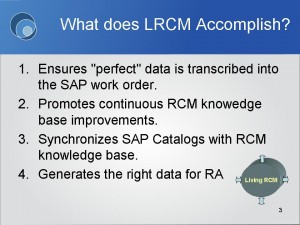
The functions of LRCM are listed on Slide 3. LRCM ensures “perfect” transcription of information into SAP. Secondly, RCM improvements occur in a natural process of exposing conflicts between the technicians’ observations and current RCM knowledge. Thirdly, as the RCM knowledge hierarchy is amended, SAP catalogs synchronize with the changes so that work orders will always be true instances of RCM Failure Modes. This is a fundamental criterion for RA. Finally, LRCM generates the correct data in the correct form for RA.
LRCM Software Functions
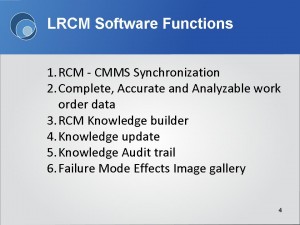
The LRCM application contains six distinct modules that accomplish these functions each of which is detailed in the subsequent slides.
- Synchronizes the CMMS failure catalogs with the changing RCM knowledge hierarchy.
- Ensures that the data on work orders is complete, accurate, and, therefore, analyzable.
- Provides a quick non-obtrusive interface for building the initial RCM analysis.
- Provides convenient and high quality updating of the RCM analysis with new work order field observations.
- Retains an audit trail of the changing RCM analysis allowing display of the knowledge state at any previous point in time.
- Uploads and displays images as required to help describe a given Failure Mode and its Effects.
1. RCM – CMMS Synchronization
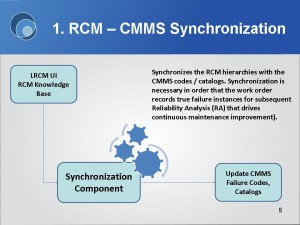
When a technician, supervisor, or planner is entering his observations into the work order form it is imperative that the catalog selection values reflect current RCM knowledge.
If this is not the case errors and omissions will occur in the work order history reducing confidence in analysis and resulting decision models. The LRCM process ensures that the CMMS Failure and Failure Mode catalogs are perfectly aligned with changing RCM knowledge.
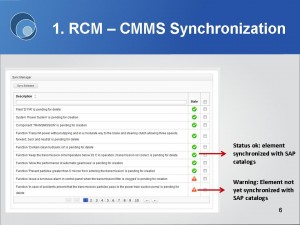
Any RCM knowledge element that is not mapped to a corresponding value in the appropriate SAP Catalog[1] will be marked appropriately (as in Slide 6) and automated synchronization may be activated.
2. Complete, Accurate and Analyzable work order data
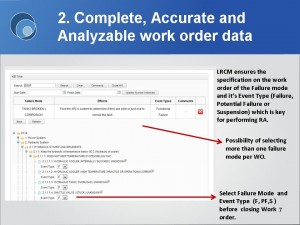
The innovative LRCM work order data entry form for accomplishing complete, accurate, and analyzable work order data is the user interface for updating a work order shown in Slide 7 .
This form displays the “live” RCM knowledge hierachy. The user selects the Failure Mode(s) addressed by the work order by clicking on the respective Event type(s). This single action guarantees precise data entry. This precision occurs because each Failure Mode, displayed in the context of its related Function, Failure, and Effects is mapped to its corresponding set of CMMS catalog codes. Additionally, the form makes clear the distinction between Failure (F) and Suspension (S). There is practically no possibility of error.
Occasionally the information in the RCM hierarchy will disagree with reality on the ground. This will be obvious to the technician or supervisor because the Effects description pops up on hovering over a Failure Mode. In cases of discrepency the Feedback function associated with each node in the tree will advise the Reliability Engineer of the needed knowledge update. All such changes to the RCM knowledge base leave a permanent audit trail. It is possible, therefore, to display any prior knowledge state. This is particularly important for the investigation of significant failure, safety incidents or accidents.
3. Initial RCM analysis
When performing RCM analysis the software’s user interface should be as unobtrusive as possible.
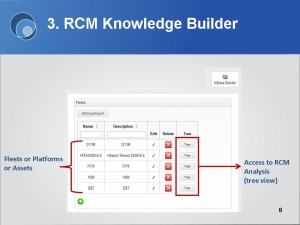
The screenshot of Slide 8 illustrates that an authorized user can select, add or delete an analysis. He can copy and paste branches from one RCM tree into other locations on the same tree or into another RCM tree view.
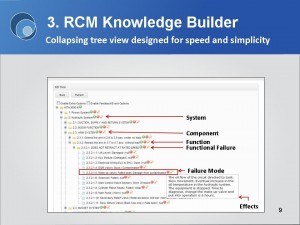
Slide 9 illustrates the tree view. The entire structure is accessible and visible and editing is done directly from the tree view of the RCM hierarchy.
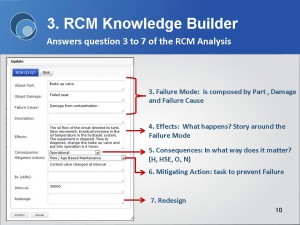
Adding and editing a Failure Mode and its Effects, Consequences, Mitigating Actions, Skills, and scheduled Interval are accomplished in the popup window of Slide 10.
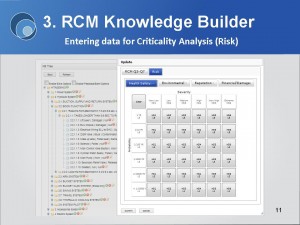
The Risk associated with each Failure Mode is analyzed in the second tab of the popup window. The selection grid, cell values, color coding, and Criticality calculation as the product of the probability and severity is configurable. Risk or “Criticality Analysis” can be useful as a way to prioritize maintenance activities or redesign.
4. Dynamic RCM
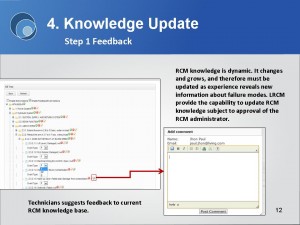
RCM knowledge is dynamic. It changes and grows, and therefore must be updated as experience reveals new information about failure modes. Slide 12 illustrates the first step in the knowledge update process – feedback from the field or shop. A pop up window allows anyone to submit text and images to suggest RCM knowledge additions or changes.
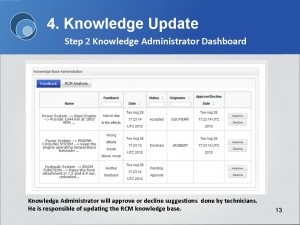
LRCM provides the capability to update RCM knowledge subject to approval of the RCM administrator. Slide 13 illustrates Step 2 in the RCM dynamic update process. A knowledge administrator dashboard allows the individual responsible for RCM knowledge quality to accept or decline each suggestion. If accepted, the screen shifts to the appropriate location on the RCM tree view where the knowledge administrator can update the new information. A permanent record of the originator, change, and date is maintained in a knowledge audit trail.
5. RCM Knowledge Audit Trail
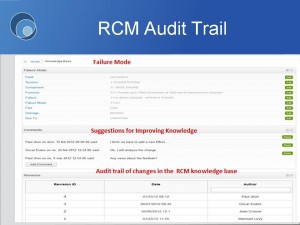
LRCM provides an audit trail of evolving knowledge. All changes to the RCM knowledge base are retained. The audit trail module records progress in the organization’s understanding of each Failure Mode, its Effects, and Consequences.
Continuous refinement of knowledge as required by the LRCM process will improve the effectiveness of maintenance.
The audit function also makes it possible to display the state of knowledge at any previous point in time. This capability is critical for thorough investigation of accidents or serious failures.
6. Failure Mode (Effects) Image Gallery
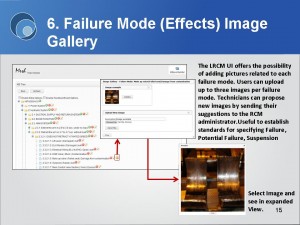
The LRCM UI offers the possibility of adding pictures related to each failure mode. Users can upload up to three images per failure mode. Technicians can propose new images by sending their suggestions to the RCM administrator. One of the main purposes of associating images with Failure Modes is to help in setting standards for declaring Failure, Potential Failure, or Suspension.
Reliability Analysis and Decision Modeling
We acquire maintenance and operational information for one main purpose, which is to analyze that information so that we can improve our decision making rules. Often this singular objective is forgotten in the heat of battle. The gathering of information becomes an end unto itself. Excessive unnecessary detail reduces the value of data. The LRCM process never strays from its objective, that of acquiring the right analysis enabling data with which to support the continuous improvement process.
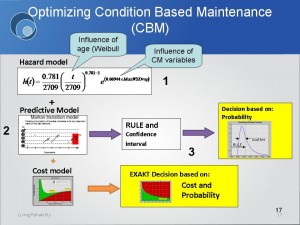
Given the scale of maintenance in a mining or energy operation, it is desirable that the process for making a CBM decision be optimal, automated, and verifiable. Slide 17 illustrates a CBM optimizing system called EXAKT. The Reliability Analysis (RA) modeling illustrated in the figure and described in the following paragraphs appears complicated. It is, in fact, quick and easy thanks to the LRCM process.
The modeling process consists of three phases labelled 1, 2 and 3 in Slide 17:
- The first phase develops the reliability model. An example of a reliability model is seen in the top left block of Figure 17. The equation is known as a “Proportional Hazard Model (PHM)” wherein h(t) is the Failure Rate function, t is the working age, and the exponent contains the significant monitored variables.
- In the second CBM modeling phase we build a prediction model, and
- Thirdly, the reliability and predictive models (of 1 and 2) are combined in the to generate a Remaining Useful Life Estimate (RULE) and an optimized model for automated decision support.
LRCM enables the benefits of powerful Reliability Analysis software
Once we have the right data in the right format entered into the CMMS (SAP, Maximo, …) advanced software procedures become available to us.
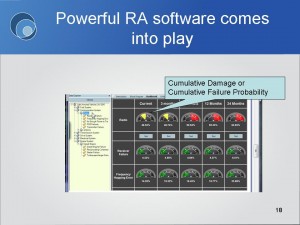
The Cumulative Failure Probability, F(t), when calculated at the time of interest, t, taking into account relevant age and sensor values, represents the percentage of “life” that has been used as a result of operation prior to t and the item’s current health state. F(t) derives from the system’s reliability block diagram, past and projected usage and maintenance, and the latest sensor data. Maintenance reduces cumulative damage while the effect of past and projected usage is to increase cumulative damage. Exploiting this data in an automated way via RA is now a reality for the first time thanks to the LRCM process and Clockwork Solution’s Command® software application.
Day-to-day criticality of systems, components, and parts
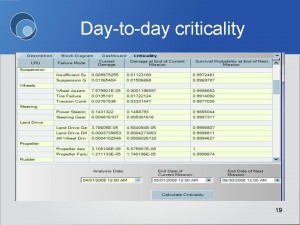
Another way of reporting the decision recommendation of the model is in terms of each failure mode’s current “criticality”.
Given the item’s current state, the projected usage, and projected maintenance schedule, what are the most critical items wanting attention? We can change the projected scenarios and run the calculation (i.e. the simulation) multiple times in order to decide on the best strategy, the one that best meets our availability, cost, and other operational requirements.
Projected failure probability for different maintenance and operation scenarios.
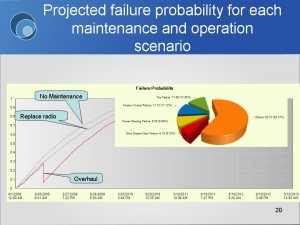
The Cumulative Failure Probability graphs of Slide 20 trace the analytic procedure that can be followed by the Reliability Engineer. He can begin by predicting the system’s Cumulative Failure Probability F(t), under a “no maintenance” scenario.
The pie chart may tell us that the radio is at this moment of interest the critical Line Replaceable Unit (LRU), the one most likely to fail in the current mission time window. If the system survival probability is unacceptable we may analyze the scenario of an immedate radio replacement and determine what would be the impact on mission survival? Will the radio replacement provide the needed system reliability over the course of the mission (say the next 1000 hours of truck or shovel operation)? This analysis discovers that the Wheel system is the next most likely source of failure.
This, in turn, would lead us to investigate the impact of a projected overhaul in six months time. Among the overhaul tasks we will include the Wheel system replacement. We run the simulation again (third curve) to determine whether this strategy will improve the truck’s reliability to the degree required to accomplish the mission. In the analysis we test different operational profiles and maintenance plans. A what-if analysis, such as that of Slide 20, will quickly point us to the most effective maintenance plan for each equipment or system.
What is a sample?
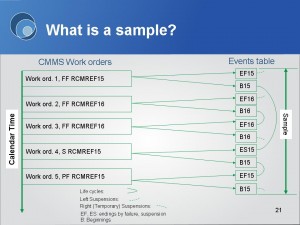
The foregoing ability to perform useful analysis and prediction depends on the quality of the data sample. By “sample” we mean an extraction of data that contains analyzable, predictive content. Most maintenance organizations are unable to produce such samples or the samples they do produce are inadequate for effective RA.
Initially, data, the way it is stored in the CMMS, is unusable for RA. It must be transformed (the arrows in Slide 21) into a Sample. A sample is a collection of Failure Mode life cycles. A beginning event (B) and ending event (EF and ES for ending by failure and suspension respectively) define each life cycle or “history”. RA software can calculate Failure Mode individual life beginnings by using the data in the CMMS database. However software cannot “infer” whether a Failure Mode ended its life by Failure or by Suspension. This information must be explicitly provided by the technician in the LRCM UI of Slide 7. RA performs by examining each Failure Mode history. It determines how each Failure correlates with the item’s virtual age[2], its projected usage, its projected maintenance, and with the item’s Condition monitored sensor data. Unless the ending event is recorded accurately as having occurred by Failure, the computation will be compromised by uncertainty, which is illustrated by the low confidence depicted in the right hand graph of Slide 22. LRCM ensures that a sample, defined by a calendar window, accounts for every life cycle (the arcs in Slide 21) including suspended life cycles (represented by dashed partial arcs}.
Why discriminate between “S” and “F”?
Not making the distinction precludes analyzing work order historical data for the purpose of developing or improving your decision models.
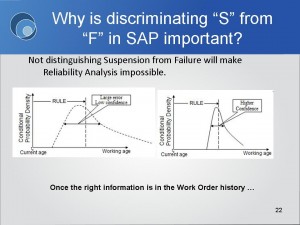
Slide22 Decision confidence reported by OMDEC’s EXAKT CBM optimizer depends on accurate Event data in the CMMS
Slide 22 illustrates in a Conditional Probability Density graph, the ability of software to report the Remaining Useful Life Estimate (RULE). Importantly, the software also reports the standard deviation, which describes the uncertainty in the RULE. It is a key performance indicator (KPI) of the effectiveness of any Condition Based Maintenance task.
When Suspensions are mistaken for Failures, the uncertainty in a decision model rises because the analysis will have been mislead into correlating a Failed State with condition and age data patterns that in reality should associate with a non-failure renewal, that is, a Suspension. The LRCM UI avoids such errors. Additionally the UI always assigns SAP catalog values correctly because the Object Failure, Object Damage, and Failure Cause are already mapped to each displayed Failure and its Effects. This mapping is transparent to the user, who need concern himself only with the RCM representation of what actually was observed.
The results achieved by LRCM
There are two types of Key Performance Indicators (KPIs). Slide 23 shows the improvement in work order information quality achieved through LRCM. Performance metrics should point us precisely to what we need to improve currently in our maintenance process. That is, they should trigger a control action. Subsequently they should confirm and measure the extent to which the control action had the desired effect.
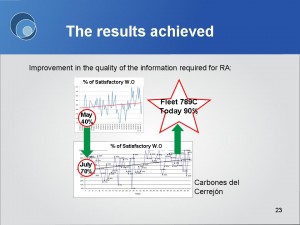
Slide23 Decision confidence reported by OMDEC’s EXAKT CBM optimizer depends on accurate Event data in the CMMS
By tracking this key metric, the organization having adopted LRCM procedures will soon possess samples appropriate for analysis, decision modeling, and driving the continuous improvement process. Low level KPI’s in maintenance measure such indicators as:
- Work order information quality,
- RCM knowledge added,
- The number of RAs performed and recommendations issued,
- CBM performance measurement such as the standard deviation in remaining useful life estimation,
- CBM hit and miss ratios (detection confidence).
Management sets low level objectives (i.e. KPI values) that:
- Employees can influence by the way they perform their duties, and that
- Support the high level organizational targets (availability, cost, safety).
Managers exercise creativity in setting low level objectives. Then they will understand the lags and complexities between the achievement of low level KPIs and the eventual resulting high level (organizational) metrics.
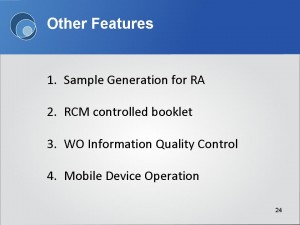
Other LRCM Features
- Sample Generation for RA: Software keeps track of the true working ages of Failure Modes. Reliability Analysis as described in the foregoing slides depends on the ability to calculate the working age of a Failure Mode life cycle whether the life cycle ends in Failure or Suspension.
- Controlled RCM Booklets: Technicians when they perform maintenance on an equipment have up to date booklets containing the RCM Tree. This reference generated by the software helps them provide accurate of Failure Mode observations matching precise SAP Catalog values.
- WO Information Quality Control: The software ensures tracking of work order information quality defined as the whether or not each work order is an accurate sample point adequate for analysis
- Mobile Device Operation: The LRCM UI can be accessed from wireless devices that may be out of range at the moment of access. The information will be submitted by the device as soon as it comes back in range.
Conclusions
For many decades now, maintenance engineers have tried to harvest data to improve the reliability and cost of operating the physical assets in their operations. They have gathered, manipulated, displayed, and stored data in great quantities. Today limitless data emanates from the CMMS as well as from embedded sensors and oil analysis programs. Operational and control data from process control historians and real time databases add more complexity to the problem of achieving reliability from fact. Despite concerted efforts a simplistic relationship between human energy exerted in data centered activities on the one hand and asset reliability, availability, and profitability on the other, has eluded engineers and managers.
Enter the missing link, living RCM (LRCM), a logical process by which to extract bottom line benefits from each maintenance initiative undertaken. LRCM binds RCM /FMEA knowledge to the work order system. Each significant work order will, as a result of that relationship, contribute a useable data point to the analysis of reliability. Why analyze reliability? There can be no measurable improvement in maintenance performance without first having conducted Reliability Analysis (RA). Further, there can be no RA without having acquired samples of data points (called histories or life cycles) at the granularity of the failure mode.
© 2012, Murray Wiseman. All rights reserved.
- [1]Maximo category, or Ellipse code↩
- [2]An item’s virtual age accounts for the past usage and maintenance of each of its components. This “accumulated damage” is calculated by the software based on SAP historical records. The virtual age of an item is calculated from the the Cumulative Failure Probability discussed in Slide 6.↩

