Maintenance departments regularly implement policies and technology aimed at improving maintenance effectiveness. However engineers who implement and justify such projects in the maintenance department often encounter difficulty when trying to quantify, credibly, a project’s impact on maintenance or on asset performance. The problem lies in the many factors governing Performance Metrics at different time periods. How do we know whether an increase in availability in a given fleet or equipment was due to our project, or to some change in production, the weather, or the insertion of other technology? The EXAKT™ / Living RCM Certified® approach to improving maintenance effectiveness answers such questions by applying a set of rigorous analytical techniques such as that described below.
A CBM policy is a rule or procedure for interpreting and acting upon condition monitoring data emanating from a physical asset. CBM effectiveness is related, to how “good” the condition data is. That is, to what degree it:
-
- Reflects internal degradation in the item, and / or
- Measures the accumulated external stress imposed on the item.
CBM effectiveness also depends on the ratio of the average[1] cost of a preventive action to the average economic consequences of failure.
![]()
Where:
C=cost of a pro-action
K=added cost due to failure
EF = histories ended by failure
ES = histories ended by proaction (suspension)
Practical CBM decision modeling depends on how well the life ending events:
-
- Failure (either PF or FF), or
- Suspension
have been discriminated in the CMMS/EAM.
Therefore to improve CBM effectiveness, we need to:
- Improve feature extraction – select features for CBM decision making that truly reflect internal or external influence[2].
- Perform CBM on items with a high (C+K)/C ratio.
- Discriminate between ending event types in the CMMS/EAM.
The combined EXAKT™ / Living RCM Certified® methodology[3] fills all three of these requirements.
How good is our CBM performance? How can we measure CBM Performance?
The following analytic procedure in EXAKT provides the means by which to assess and compare CBM performance in various calendar periods and to predict the performance of a proposed prognostic model. This method can be used by maintenance managers to justify expanding or adjusting (or abandoning) a given CBM task. We illustrate the procedure by performing Exercise 1 [4]and then executing the following steps:
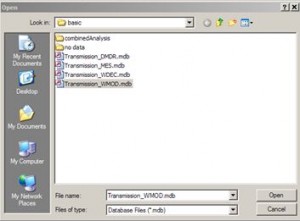
- ExaktM, File, Open, Navigate to folder test\Files_For_Exercise1, Transmission_WMOD.mdb, Open
- Modeling, Select Current Model

- TransOil Anal, il, OK

- Modeling

- Decision Model
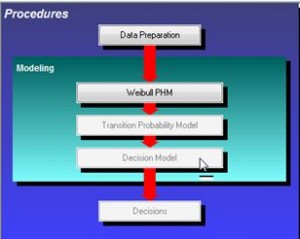
- Cost Comparison

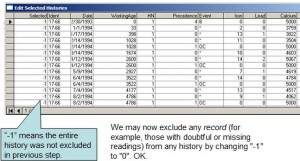
- Exclude (in the dialog shown in the 2nd figure below) Histories that
-
- Have only just begun at the time of this analysis. (easily identified in View, Histories.)
- Are missing a substantial number of inspections
- Are part of another time window. And we want to compare peformance in two separate time windows. That is we want to determine if the model has maintained or improved its effectiveness.
(The above conditions for history exclusion may be easily identified using the EXAKT View, Histories functions as in the figure below.)
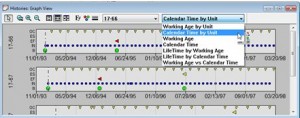 Checking a history (in the dialog of the next image) will exclude it.
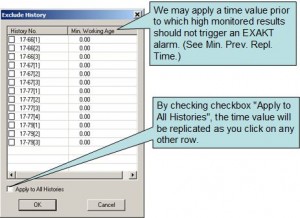 Apply minimum working age (3rd column in diagram above) for preventive intervention.
This is an option in EXAKT which may be used when setting the model’s decision parameters. Sometimes there is a short period of time at the beginning of a life cycle where the mechanical components are “bedding in” or “wearing in”. During this period monitored variables, such as wear metals may be abnormally high. This would cause the hazard as calculated by the PHM to be expectedly high. But the model should not return a potential failure alarm during this transitory period. By setting this parameter, we avoid false alarms during the bedding in time. -
- Edit individual histories that were not excluded in the previous step.
- Examine the “Summary of Decision Model Parameters”.
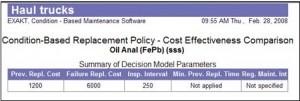 Where:
- Minimum preventive maintenance time
See explanation given in step 7. And - Regular maintenance interval
Is an option in EXAKT that is used when setting the decision parameters. This optional parameter of the CBM Model will, if applicable, improve the calculation of the optimal policy. The Regular Maintenance Interval refers to non-rejuvenating events performed regularly in time and those actions are known to impact the covariate values. Such events may include minor adjustments, calibrations or oil changes carried out at some interval of the working age. For example, oil changes performed every 600 hours.
- Minimum preventive maintenance time
- Examine the “Summary of Events and Decided Histories”.
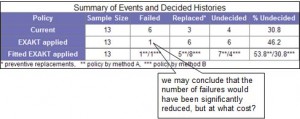 Where:
- “Current”:
What actually occurred? Of the 13 actual histories in the sample 6 failed, 3 were replaced, and 4 are “undecided” – that is, at this time we do not know whether they will eventually fail or be preventively replaced. (At present they are still operating).
- EXAKT applied:When the EXAKT policy is applied retroactively to the data set,
- 1 history would have ended having failed,
- 6 would have been preventively replaced, and
- 6 would have been undecided
We may conclude that the number of failures would have been significantly reduced, but this is not enough to justify the CBM policy. We need to determine (in step 11) the relative cost of the improved failure rate.
- Fitted EXAKT applied: The curve of the EXAKT decision chart is fitted to the actual data; so as to minimize “average” realized cost.
- “Current”:
- Examine Cost Summary Tables A and B
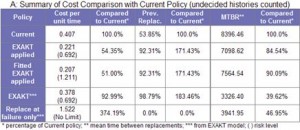
- EXAKT applied:
The cost of the policy obtained from applying the optimal model retroactively to the sample.
- Fitted EXAKT applied: The curve of the EXAKT decision chart is fitted to the actual data; so as to minimize “average” realized cost.
- EXAKT: The theoretical “expected” cost effectiveness of the EXAKT model. It is a projection of the future effectiveness of the proposed policy for opposing assumptions A and B.
- Replace at failure: The policy of not using any proactive (neither scheduled nor on-condition) maintenance
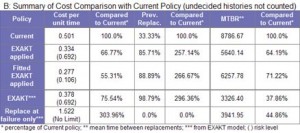
- Table B provides the other extreme assumption. While Table A assumed that histories that are at present incomplete will have been (successfully) preventively replaced by the proposed decision model, Table B simply ignores the incomplete histories. One may consider the assumptions of A and B as defining the envelope of possibilities of future performance of the model. If both provide satisfactory results (in the columns “Compared to Current”), we may confidently estimate the value of the proposed CBM policy and apply the model going forward.
- EXAKT applied:
Conclusion
- The above analysis procedure provides a way to judge the potential benefits of a proposed CBM policy.
- It also provides a way to track and compare CBM performance in different calendar periods as an objective way to document improvements in maintenance performance.
- It uses various sets of assumptions and calculations to probe the robustness of the proposed CBM decision model and the credibility of its impact on maintenance effectiveness (asset performance).
- It is a tool that a maintenance engineer may use to gain a degree of comfort by arriving at similar numbers using calculations at the extreme edges of the envelope of possibilities when applying the proposed model. In the above case tables A and B calculate improvement in the range of 25 to 50%, indicating that we can expect an average improvement (over the current policy) of 33% by applying EXAKT optimization.
- It is a statistically robust and valid method for demonstrating the value, with regard to bottom line profitability resulting from a given CBM policy.
- The “living” RCM methodology enables such decision support by ensuring the quality of EAM data.
© 2012 – 2019, Murray Wiseman. All rights reserved.
- [1]Average relative costs of failure versus prevention are a good input to a decision process because: 1) They are well understood and can be reasonably ball-parked by managers and engineers. And, 2) The software permits sensitivity analysis that determines to what extent errors in the assumption of average costs will impact the validity of the proposed policy’s projected performance.↩
- [2]We refer here to the “influence” of a risk factor, such as a monitored data point, on failure probability. The premise of CBM, of course, is that monitored data influences (i.e. reflects) failure probability. It is incumbent on the maintenance or reliability engineer to discover the respective influence of available monitored data and develop an interpretive model for decision making. ↩
- [3]EXAKT™ is a software enabled technique for correlating condition data and maintenance history and generating a CBM decision model (i.e. a rule for interpreting CBM data) based on probability and business factors. LRCM (living RCM) is a work order integrated procedure that uses the Mesh™ EAM add-on module for ensuring accurate data for reliability analysis and decision modeling.↩
- [4]This link (https://www.livingreliability.com/en/posts/cbm-exercises/) provides a full functioned time limited version of the EXAKT software as well as a series of exercises with data for gaining proficiency in its use.↩
- Confidence in predictive maintenance (40.6%)
- Structured free text (39.7%)
- What is Maintenance Decision Automation? (34.1%)
- EXAKT cost sensitivity analysis (33.2%)
- Automating CBM (31.4%)
- Inspections - CBM and others (RANDOM - 5.2%)

[…] Continuous CBM decision improvement […]
[…] The decisions table is typically viewed using the EAM report generator or in a dashboard. Now that we have freed the reliability engineer from the drudgery of examination and interpretation of routine CBM data, he can turn his attention to Measuring and Improving CBM Effectiveness. […]
[…] exert additional CBM effort? To answer these questions, begin by repeat steps 1 to 5 in the article Measuring CBM Effectiveness and then hit the Cost Sensitivity button as shown in the image […]